Lab 12 - Kubernetes
In this lab, you're going to create a Kubernetes cluster to use in running application containers in a scalable and fault tolerant manner.
Overview
Kuberentes, also known as "K8s", is a container orchestration system. It automates the deployment of containers, the scaling of deployments under production load, and the management of containers across a cluster.
In this lab, you are going to build a Kubernetes cluster of 3 instances:
- 1 Controller (or master) node
- 2 Worker nodes
With these three nodes, you can have all the standard Kubernetes Components of a typical cluster.
The controller node is responsible for making global decisions about the cluster, such as scheduling, along with responding to cluster events such as node failures. The controller runs a number of essential services, including:
- Kubeadm - The Kubernetes Admin tool helps to quickly build a cluster by providing
kubeadm initandkubeadm joinfunctionality. - kube-apiserver - The API server provides access to the Kubernetes control plane
- etcd - This is a consistent and high-availability key value store that Kubernetes uses to store all cluster data
- kube-scheduler - The scheduler is a control plane component that takes a newly created pod (group of application containers), and picks a node to run it based on system load, data locality, and other runtime considerations.
- kube-controller-manager - This control plane component runs controller processes, such as the node controller (which detects when nodes fail), replication controller (which maintains the correct number of replicas for every pod), endpoint controller, and service account & token controller.
Note: Technically, all of these services could be run on multiple nodes in the cluster for greater redundancy and fault tolerance. That is why Kubernetes documentation refers to this as a "Control Plane" instead of a Controller node.
The worker nodes are responsible for running the application containers. The workers run a number of essential services, including:
- Container Runtime: containerd, CRI-O, or Docker
- Kubelet - This agent makes sure that containers are running in a Pod.
- Kube-proxy - This component maintains network rules on nodes, allowing for network communication inside and outside of the cluster.
Part 1 - Install Kubernetes
References
- Install Kubernetes on Ubuntu
- Install Kubernetes on Ubuntu 20.04
- How to Install Kubernetes (k8s) on Ubuntu 20.04 LTS Server
Create AWS Security Groups
Kubernetes requires specific ports to be open on both the controller and worker nodes. Use these requirements for your AWS Security Groups.
Create a new security group: Tiger-K8s-Controller
- VPC:
Tiger-VPC - Inbound rules - many of these only allow access from inside Tiger-VPC or via the VPN:
SSHfrom sourceAnywhere-IPv4All ICMP - IPv4from sourceAnywhere-IPv4(This permits ICMP pings for network debugging)- TCP port 6443 from source
10.101.0.0/16(Kubernetes API server) - TCP port 2379-2380 from source
10.101.0.0/16(etcd server client API) - TCP port 10250 from source
10.101.0.0/16(Kubelet API) - TCP port 10251 from source
10.101.0.0/16(kube-scheduler) - TCP port 10252 from source
10.101.0.0/16(kube-controller-manager) - UDP port 8285 from source
10.101.0.0/16(Flannel Overlay Network) - This makes a huge difference in functionality! - UDP port 8472 from source
10.101.0.0/16(Flannel Overlay Network) - This makes a huge difference in functionality!
Create a new security group: Tiger-K8s-Worker
- VPC:
Tiger-VPC - Inbound rules - many of these only allow access from inside Tiger-VPC or via the VPN:
SSHfrom sourceAnywhere-IPv4All ICMP - IPv4from sourceAnywhere-IPv4(This permits ICMP pings for network debugging)- TCP port 10250 from source
10.101.0.0/16(Kubelet API) - TCP port 30000-32767 from source
10.101.0.0/16(NodePort Services) - UDP port 8285 from source
10.101.0.0/16(Flannel Overlay Network) - This makes a huge difference in functionality! - UDP port 8472 from source
10.101.0.0/16(Flannel Overlay Network) - This makes a huge difference in functionality!
Tip: Double-check these security groups twice before proceeding! Missing an entry, or mixing up TCP vs UDP, is the number one cause of errors later in the lab.
Create AWS Instances
Create three new EC2 instance at AWS meeting the following requirements. According to the Kubeadm system requirements, each instance should have at minimum 2 CPUs and 2GB of RAM and full network connectivity between all instances.
Tip: You could run the wizard three times, creating one instance each time. Or, you could run the wizard once and set "Number of Instances" to three. The only caveat is that the wizard forces the tag(s) and security group(s) to be set identically. So, if you take the path of creating 3 instances at once, you'll need to manually update the tags and security groups after the instances are created.
- AMI: Latest Amazon-provided Ubuntu 20.04 image - x86_64
- Instance type: t2.medium (2 vCPU, 4 GiB memory) - A larger node with more CPUs and RAM
- Network: “Tiger-VPC"
- Subnet: “Tiger-VPC-Public” # Select the PUBLIC subnet
- Auto-assign Public IP: Use Subnet setting (Enable)
- Storage: 8GiB with "Delete on Termination" enabled
- Tag: Name = Either
K8s-ControllerorK8s-Worker-01orK8s-Worker-02as appropriate - Security Group: Either
Tiger-K8s-ControllerorTiger-K8s-Workeras appropriate - Keypair: Existing keypair / “COMP-175-Lab-1"
Set Hostnames (ALL INSTANCES)
To reduce the possibility of confusion, first set unique hostnames on all instances.
- Controller (or master) -
k8s-controller - Nodes -
k8s-worker01,k8s-worker02, ...
Synchronize Time (ALL INSTANCES)
To ensure system clocks are synchronized across the cluster, install chrony and configure it to use the AWS time server accessible via the link local IP address 169.254.169.123. Verify that chrony is running.
Install Docker (ALL INSTANCES)
For our Container Runtime, we will use Docker. Install the Docker CE (Container Engine) on all instances node as was done in the previous lab. Even the controller needs Docker running for all the control plane services. Ensure that Docker CE is running and set to launch automatically when the system boots.
BUGFIX FALL 2021
Control Groups ("cgroups") are a mechanism for Linux to control resources, such as CPU time, system memory, and network bandwidth. Docker (by default) wants to use the cgroup driver "cgroupfs", while Kubernetes (by default) wants to use the cgroup driver "systemd". A rock meets a hard place, but someone has to yield. Let's switch Docker to use systemd.
Create a config file for Docker:
$ sudo nano /etc/docker/daemon.jsonPut the following contents in daemon.json:
{
  "exec-opts": ["native.cgroupdriver=systemd"]
}
Restart the Docker service:
$ sudo systemctl restart dockerInstall Kubernetes (ALL INSTANCES)
Install apt-transport-https to access application repositories over HTTPS instead of HTTP:
$ sudo apt install curl apt-transport-httpsAdd Kubernetes signing key:
$ curl -s https://packages.cloud.google.com/apt/doc/apt-key.gpg | sudo apt-key addAdd Kubernetes software repository:
Note: Ubuntu 20.04 is "Focal", but the latest Kubernetes explicitly supported version as of Nov 2021 is Ubuntu 16.04 ("Xeniel"). You can check for supported distributions directly in the repository.
$ sudo apt-add-repository "deb http://apt.kubernetes.io/ kubernetes-xenial main"Install Kubernetes
$ sudo apt install kubeadm kubelet kubectl kubernetes-cniVerify that the installation succeeded:
$ kubeadm version

# Example Output:
#    kubeadm version: &version.Info{Major:"1", Minor:"22", GitVersion:"v1.22.2",
#    GitCommit:"8b5a19147530eaac9476b0ab82980b4088bbc1b2", GitTreeState:"clean",
#    BuildDate:"2021-09-15T21:37:34Z", GoVersion:"go1.16.8", Compiler:"gc",
#    Platform:"linux/amd64"}
Disable Swap (ALL INSTANCES)
Kubernetes will not run on nodes that have disk swap enabled. Swap is where the operating system will write out infrequently used data from RAM to disk in order to free up RAM for other purposes. While this increases system flexibility, it can degrade performance significantly, and interfere with Kubernetes trying to manage the cluster for maximum performance and flexibility. (See discussion of swap in Kubernetes)
# Disable swap immediately
$ sudo swapoff -a

# Not needed for AWS Ubuntu image:
# Disable swap permanently after reboot
# Edit file /etc/fstab
# sudo nano /etc/fstab
# Comment out (with #) the line containing "swap"
# With this change, no swap file or partition is
# ever mounted and swap will be disabled.
Initialize Kubernetes Control Server (CONTROLLER ONLY)
Initialize the Kubernetes master node.
Reference:
Use the --pod-network-cidr argument to specify a range of IP addresses for the POD network. The control plane will automatically allocate CIDRs for every node within this range. Tiger-VPC has the range 10.101.0.0/16 and currently 10.101.0.0/24 is in use for the public subnet. Pick a range that is outside of Tiger-VPC - it's ok, because these are virtual addresses that are tunneled over the physical network anyway. 10.244.0.0/16 is popular in K8s documentation.
Tip: Did you screw up on a kubeadm init or kubeadm join stage? Do sudo kubeadm reset to wipe it out and try again.
k8s-master$ sudo kubeadm init --pod-network-cidr=10.244.0.0/16

# Example Output:
#[init] Using Kubernetes version: v1.22.2
#[preflight] Running pre-flight checks
#[preflight] Pulling images required for setting up a Kubernetes cluster
#[preflight] This might take a minute or two, depending on the speed of your internet connection
#[preflight] You can also perform this action in beforehand using 'kubeadm config images pull'
#[certs] Using certificateDir folder "/etc/kubernetes/pki"
#[certs] Generating "ca" certificate and key
#[certs] Generating "apiserver" certificate and key
#[certs] apiserver serving cert is signed for DNS names [k8s-controller kubernetes kubernetes.default kubernetes.default.svc kubernetes.default.svc.cluster.local] and IPs [10.96.0.1 10.101.0.60]
#[certs] Generating "apiserver-kubelet-client" certificate and key
#[certs] Generating "front-proxy-ca" certificate and key
#[certs] Generating "front-proxy-client" certificate and key
#[certs] Generating "etcd/ca" certificate and key
#[certs] Generating "etcd/server" certificate and key
#[certs] etcd/server serving cert is signed for DNS names [k8s-controller localhost] and IPs [10.101.0.60 127.0.0.1 ::1]
#[certs] Generating "etcd/peer" certificate and key
#[certs] etcd/peer serving cert is signed for DNS names [k8s-controller localhost] and IPs [10.101.0.60 127.0.0.1 ::1]
#[certs] Generating "etcd/healthcheck-client" certificate and key
#[certs] Generating "apiserver-etcd-client" certificate and key
#[certs] Generating "sa" key and public key
#[kubeconfig] Using kubeconfig folder "/etc/kubernetes"
#[kubeconfig] Writing "admin.conf" kubeconfig file
#[kubeconfig] Writing "kubelet.conf" kubeconfig file
#[kubeconfig] Writing "controller-manager.conf" kubeconfig file
#[kubeconfig] Writing "scheduler.conf" kubeconfig file
#[kubelet-start] Writing kubelet environment file with flags to file "/var/lib/kubelet/kubeadm-flags.env"
#[kubelet-start] Writing kubelet configuration to file "/var/lib/kubelet/config.yaml"
#[kubelet-start] Starting the kubelet
#[control-plane] Using manifest folder "/etc/kubernetes/manifests"
#[control-plane] Creating static Pod manifest for "kube-apiserver"
#[control-plane] Creating static Pod manifest for "kube-controller-manager"
#[control-plane] Creating static Pod manifest for "kube-scheduler"
#[etcd] Creating static Pod manifest for local etcd in "/etc/kubernetes/manifests"
#[wait-control-plane] Waiting for the kubelet to boot up the control plane as static Pods from directory "/etc/kubernetes/manifests". This can take up to 4m0s
#[apiclient] All control plane components are healthy after 10.002686 seconds
#[upload-config] Storing the configuration used in ConfigMap "kubeadm-config" in the "kube-system" Namespace
#[kubelet] Creating a ConfigMap "kubelet-config-1.22" in namespace kube-system with the configuration for the kubelets in the cluster
#[upload-certs] Skipping phase. Please see --upload-certs
#[mark-control-plane] Marking the node k8s-controller as control-plane by adding the labels: [node-role.kubernetes.io/master(deprecated) node-role.kubernetes.io/control-plane node.kubernetes.io/exclude-from-external-load-balancers]
#[mark-control-plane] Marking the node k8s-controller as control-plane by adding the taints [node-role.kubernetes.io/master:NoSchedule]
#[bootstrap-token] Using token: p3fqys.4w9tnc0kk8fnzy4l
#[bootstrap-token] Configuring bootstrap tokens, cluster-info ConfigMap, RBAC Roles
#[bootstrap-token] configured RBAC rules to allow Node Bootstrap tokens to get nodes
#[bootstrap-token] configured RBAC rules to allow Node Bootstrap tokens to post CSRs in order for nodes to get long term certificate credentials
#[bootstrap-token] configured RBAC rules to allow the csrapprover controller automatically approve CSRs from a Node Bootstrap Token
#[bootstrap-token] configured RBAC rules to allow certificate rotation for all node client certificates in the cluster
#[bootstrap-token] Creating the "cluster-info" ConfigMap in the "kube-public" namespace
#[kubelet-finalize] Updating "/etc/kubernetes/kubelet.conf" to point to a rotatable kubelet client certificate and key
#[addons] Applied essential addon: CoreDNS
#[addons] Applied essential addon: kube-proxy
#
#Your Kubernetes control-plane has initialized successfully!
#
#To start using your cluster, you need to run the following as a regular user:
#
#  mkdir -p $HOME/.kube
#  sudo cp -i /etc/kubernetes/admin.conf $HOME/.kube/config
#  sudo chown $(id -u):$(id -g) $HOME/.kube/config
#
#Alternatively, if you are the root user, you can run:
#
#  export KUBECONFIG=/etc/kubernetes/admin.conf
#
#You should now deploy a pod network to the cluster.
#Run "kubectl apply -f [podnetwork].yaml" with one of the options listed at:
#  https://kubernetes.io/docs/concepts/cluster-administration/addons/
#
#Then you can join any number of worker nodes by running the following on each as root:
#
#kubeadm join 10.101.0.60:6443 --token XXXXXXXXXXXXXXXXXXXX \
#   --discovery-token-ca-cert-hash sha256:YYYYYYYYYYYYYYYYYYYY
If successful, the kubeadm init command will produce a kubeadm join command that can be used to connect worker nodes to the controller. Save that command - you'll need it later.
The kubeadm init command will also produce a list of commands to run as your regular user (in this case, the ubuntu user.) Run these commands on the controller now, to put a file in your home directory with some important configuration variables.
# Make a directory called .kube in your home directory
k8s-controller$ mkdir -p $HOME/.kube
# Copy admin.conf into that directory, and rename it to config
k8s-controller$ sudo cp -i /etc/kubernetes/admin.conf $HOME/.kube/config
# Set permissions on the file so it is owned by the current user and group
k8s-controller$ sudo chown $(id -u):$(id -g) $HOME/.kube/configNote: By creating this config file (with the secret keys), you have granted your ubuntu user permission to manage the Kubernetes cluster. Do not just haphazardly use sudo in the future in front of kubectl commands. The root user does not have these settings and permissions!
View your client information (that was provided by the config file set above)
k8s-controller$ kubectl config view

# Example Output:
# apiVersion: v1
# clusters:
# - cluster:
#     certificate-authority-data: DATA+OMITTED
#     server: https://10.101.0.60:6443
#   name: kubernetes
# contexts:
# - context:
#     cluster: kubernetes
#     user: kubernetes-admin
#   name: kubernetes-admin@kubernetes
# current-context: kubernetes-admin@kubernetes
# kind: Config
# preferences: {}
# users:
# - name: kubernetes-admin
#   user:
#     client-certificate-data: REDACTED
#     client-key-data: REDACTED
View your cluster information:
k8s-master$ kubectl cluster-info

# Example Output:
# Kubernetes control plane is running at https://10.101.0.60:6443
# CoreDNS is running at https://10.101.0.60:6443/api/v1/namespaces/kube-system/services/kube-dns:dns/proxy
#
# To further debug and diagnose cluster problems, use 'kubectl cluster-info dump'.
Deploy Pod Network (CONTROLLER ONLY)
Flannel is a virtual overlay network for the cluster. In conventional Docker installations, each container gets an IP address that allows for communication on the same host. In order to communicate across the network, port mapping must be used, which hinders communication. In contrast, Flannel allows for containers to communicate by giving each host in the cluster an entire subnet of (virtual) network addresses, and allowing Docker to assign addresses from within that subnet.
References
Use Kubernetes to install Flannel on all nodes in the cluster
k8s-controller$ kubectl apply -f https://raw.githubusercontent.com/coreos/flannel/master/Documentation/kube-flannel.ymlVerify that Flannel is running by looking for the kube-flannel pod in the Running state:
k8s-controller$ kubectl get pods --all-namespaces

# Example Output (Should see kube-flannel-ds with status RUNNING)
# NAMESPACE     NAME                                     READY   STATUS    RESTARTS   AGE
# kube-system   coredns-f9fd979d6-lwj9k                  1/1     Running   0          50s
# kube-system   coredns-f9fd979d6-s6l6r                  1/1     Running   0          50s
# kube-system   etcd-k8s-controller                      1/1     Running   0          66s
# kube-system   kube-apiserver-k8s-controller            1/1     Running   0          66s
# kube-system   kube-controller-manager-k8s-controller   1/1     Running   0          66s
# kube-system   kube-flannel-ds-q9gr8                    1/1     Running   0          19s
# kube-system   kube-proxy-pvfxs                         1/1     Running   0          50s
# kube-system   kube-scheduler-k8s-controller            0/1     Running   0          66s
Join Workers to Cluster (WORKERS ONLY)
Use the kubeadm join command to join each worker to the cluster controller. Note: This command does need to be run with sudo.
# This should be the 'kubeadm join' command previously displayed after 'kubeadm init' was run.
# Did you lose that command?  You can find it again via:
#    kubeadm token create --print-join-command 2> /dev/null
k8s-worker$ sudo kubeadm join  a.b.c.d:6443 --token XXXXX --discovery-token-ca-cert-hash YYYYYY
On the controller node, verify that your worker nodes have both joined:
k8s-controller$ kubectl get nodes

# Example output: Should see THREE nodes, all with status of Ready
# NAME             STATUS   ROLES                  AGE   VERSION
# k8s-controller   Ready    control-plane,master   11m   v1.22.2
# k8s-worker-01    Ready    <none>                 22s   v1.22.2
# k8s-worker-02    Ready    <none>                 20s   v1.22.2
Deploy the Metrics Server (CONTROLLER ONLY)
The metrics server collects resource metrics from Kubelets and exposes them in Kubernetes apiserver for use by Horizontal and Vertical Pod Autoscalers.
References:
- Kubernetes metrics server
- Kubernetes metrics-server Installation
- How To Deploy Metrics Server to Kubernetes Cluster
This particular component requires some minor customization to function in the cluster. Download the YAML file but don't apply it. Instead, open it in a text editor.
k8s-controller$ wget https://github.com/kubernetes-sigs/metrics-server/releases/latest/download/components.yaml
k8s-controller$ nano components.yaml
Make the following modifications to components.yaml to fix "cannot validate certificate" errors, and potentially also hostname resolution errors. This can be modified starting at line 132, in the spec.template.spec.containers level. There is already an args block there setting --cert-dir=/tmp and --secure-port=443 - search for that to jump to the right place. Simply add one additional arguments (--kubelet-insecure-tls) and ensure that --kubelet-preferred-address-types sets InternalIP as the first choice. Be sure to be consistent with indentation, and use spaces!
Desired partial contents of components.yaml after editing:
    spec:
      containers:
      - args:
        - --cert-dir=/tmp
        - --secure-port=443
        - --kubelet-preferred-address-types=InternalIP,ExternalIP,Hostname
        - --kubelet-insecure-tls
        - --kubelet-use-node-status-port
        - --metric-resolution=15s
Then apply your edited components.yaml script to the cluster to start the metrics server.
k8s-controller$ kubectl apply -f components.yamlWait 60 seconds for the metrics-server to load. Now use it to get a snapshot of resource utilization (CPU and memory) at the node and individual Pod level.
k8s-controller$ kubectl top nodes

# Example Output:
# NAME             CPU(cores)   CPU%   MEMORY(bytes)   MEMORY%
# k8s-controller   118m         5%     911Mi           23%
# k8s-worker01     35m          1%     591Mi           15%
# k8s-worker02     41m          2%     717Mi           18%

k8s-controller$ kubectl top pods --all-namespaces

# Example Output:
# NAMESPACE     NAME                                     CPU(cores)   MEMORY(bytes)
# kube-system   coredns-78fcd69978-qg7wx                 2m           11Mi
# kube-system   coredns-78fcd69978-trp52                 2m           11Mi
# kube-system   etcd-k8s-controller                      18m          39Mi
# kube-system   kube-apiserver-k8s-controller            54m          395Mi
# kube-system   kube-controller-manager-k8s-controller   17m          48Mi
# kube-system   kube-flannel-ds-bpm9j                    2m           10Mi
# kube-system   kube-flannel-ds-lrxxd                    2m           11Mi
# kube-system   kube-flannel-ds-s8lw8                    2m           11Mi
# kube-system   kube-proxy-8hh92                         1m           12Mi
# kube-system   kube-proxy-mps6c                         1m           20Mi
# kube-system   kube-proxy-wxpm4                         3m           12Mi
Deliverables:
- Submit a screenshot of the output of
kubectl top nodesandkubectl top pods --all-namespacesshowing cluster CPU and memory utilization.
Troubleshooting
Common causes for a non-operational metrics server include:
- Incorrect editing of the
components.yamlfile - Incorrect firewall rules for either the controller or worker nodes. (In particular, the firewall rules related to the Flannel cross-cluster networking layer).
To dig deeper, get a list of deployments and then view the log file for the metric-server deployment:
k8s-controller$ kubectl get deploy --all-namespaces
k8s-controller$ kubectl logs -n kube-system deploy/metrics-server
# Logs...
Deploy the Dashboard Web UI (CONTROLLER ONLY)
Dashboard is a web-based Kubernetes user interface. You can use Dashboard to deploy containerized applications to a Kubernetes cluster, troubleshoot your containerized application, and manage the cluster resources.
References:
Install Dashboard
Install the Dashboard components:
k8s-controller$ kubectl apply -f https://raw.githubusercontent.com/kubernetes/dashboard/v2.3.1/aio/deploy/recommended.yamlVerify that the dashboard is running by obtaining a list of deployments, services and pods in the namespace kubernetes-dashboard (where these pods are running by default).
k8s-controller$ kubectl get deploy --all-namespaces

# Example Output
# NAMESPACE              NAME                        READY   UP-TO-DATE   AVAILABLE   AGE
# kube-system            coredns                     2/2     2            2           7h51m
# kube-system            metrics-server              1/1     1            1           26m
# kubernetes-dashboard   dashboard-metrics-scraper   1/1     1            1           7h48m
# kubernetes-dashboard   kubernetes-dashboard        1/1     1            1           7h48m

k8s-controller$ kubectl get services -n kubernetes-dashboard

# Example Output
# NAME                        TYPE        CLUSTER-IP    EXTERNAL-IP   PORT(S)    AGE
# dashboard-metrics-scraper   ClusterIP   10.104.85.7   <none>        8000/TCP   7h18m
# kubernetes-dashboard        ClusterIP   10.97.7.214   <none>        443/TCP    7h18m

k8s-controller$ kubectl get pods -n kubernetes-dashboard

# Example Output
# NAME                                         READY   STATUS    RESTARTS   AGE
# dashboard-metrics-scraper-7b59f7d4df-s29zr   1/1     Running   0          7h14m
# kubernetes-dashboard-74d688b6bc-2c9lp        1/1     Running   0          7h14m
Create a Dashboard Admin User
Create an Admin user that has permission to access the dashboard and modify the cluster via the dashboard.
Create a directory for the dashboard configuration files:
k8s-controller$ mkdir ~/dashboard && cd ~/dashboard
k8s-controller$ nano dashboard-admin.yaml
Create the following configuration and save it in the dashboard-admin.yaml file. Note that indentation matters in the YAML files! Use spaces.
apiVersion: v1
kind: ServiceAccount
metadata:
  name: admin-user
  namespace: kubernetes-dashboard
---
apiVersion: rbac.authorization.k8s.io/v1
kind: ClusterRoleBinding
metadata:
  name: admin-user
roleRef:
  apiGroup: rbac.authorization.k8s.io
  kind: ClusterRole
  name: cluster-admin
subjects:
- kind: ServiceAccount
  name: admin-user
  namespace: kubernetes-dashboard
Deploy the admin user role:
k8s-controller$ kubectl apply -f dashboard-admin.yaml
# serviceaccount/admin-user created
# clusterrolebinding.rbac.authorization.k8s.io/admin-user created
Get the admin token for this user:
k8s-controller$ kubectl get secret -n kubernetes-dashboard $(kubectl get serviceaccount admin-user -n kubernetes-dashboard -o jsonpath="{.secrets[0].name}") -o jsonpath="{.data.token}" | base64 --decodeThe token is created each time the dashboard is deployed and is required to log into the dashboard.
Notes:
1.) The token will change if the dashboard is stopped and redeployed.
2.) The token is LONG and runs right into the ubuntu@k8s-controller command prompt. Be very careful in what text you copy and paste for your token.
Access Dashboard
To access the Dashboard, you must create a secure channel to your Kubernetes cluster using the command kubectl proxy. In a normal deployment this would be done on your personal workstation (where your web browser is), allowing you to access the Dashboard at http://localhost:8001. However, your local computer does not currently have any of the Kubernetes tools or configuration ready. What to do? The quick solution is to run the proxy on a cluster node (which already has all the Kubernetes tooling), and use SSH Local Port Forwarding so that port 8001 on your personal computer is forwarded to port 8001 on the SSH server (aka k8s-controller). Either disconnect your current SSH session with the controller, or create a new SSH session. Yes, you can have multiple SSH sessions to the same destination. When creating the new SSH session, be sure to enable port forwarding.
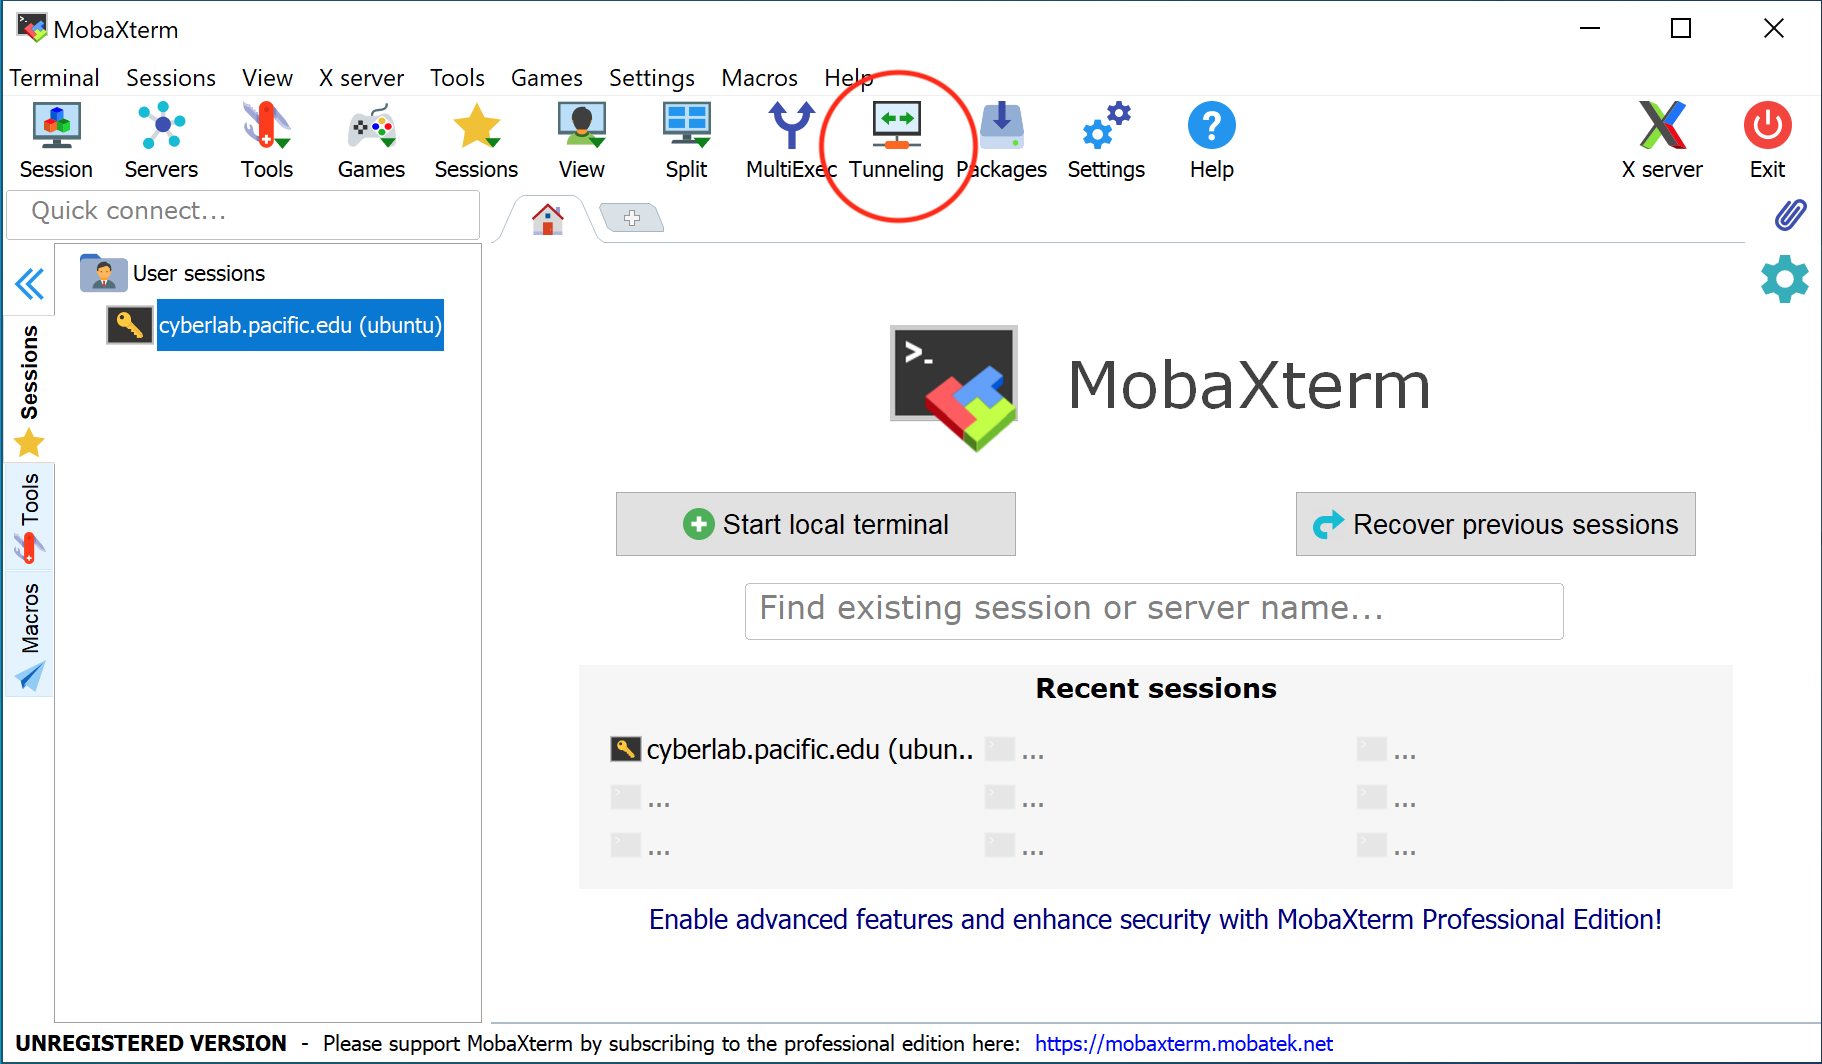
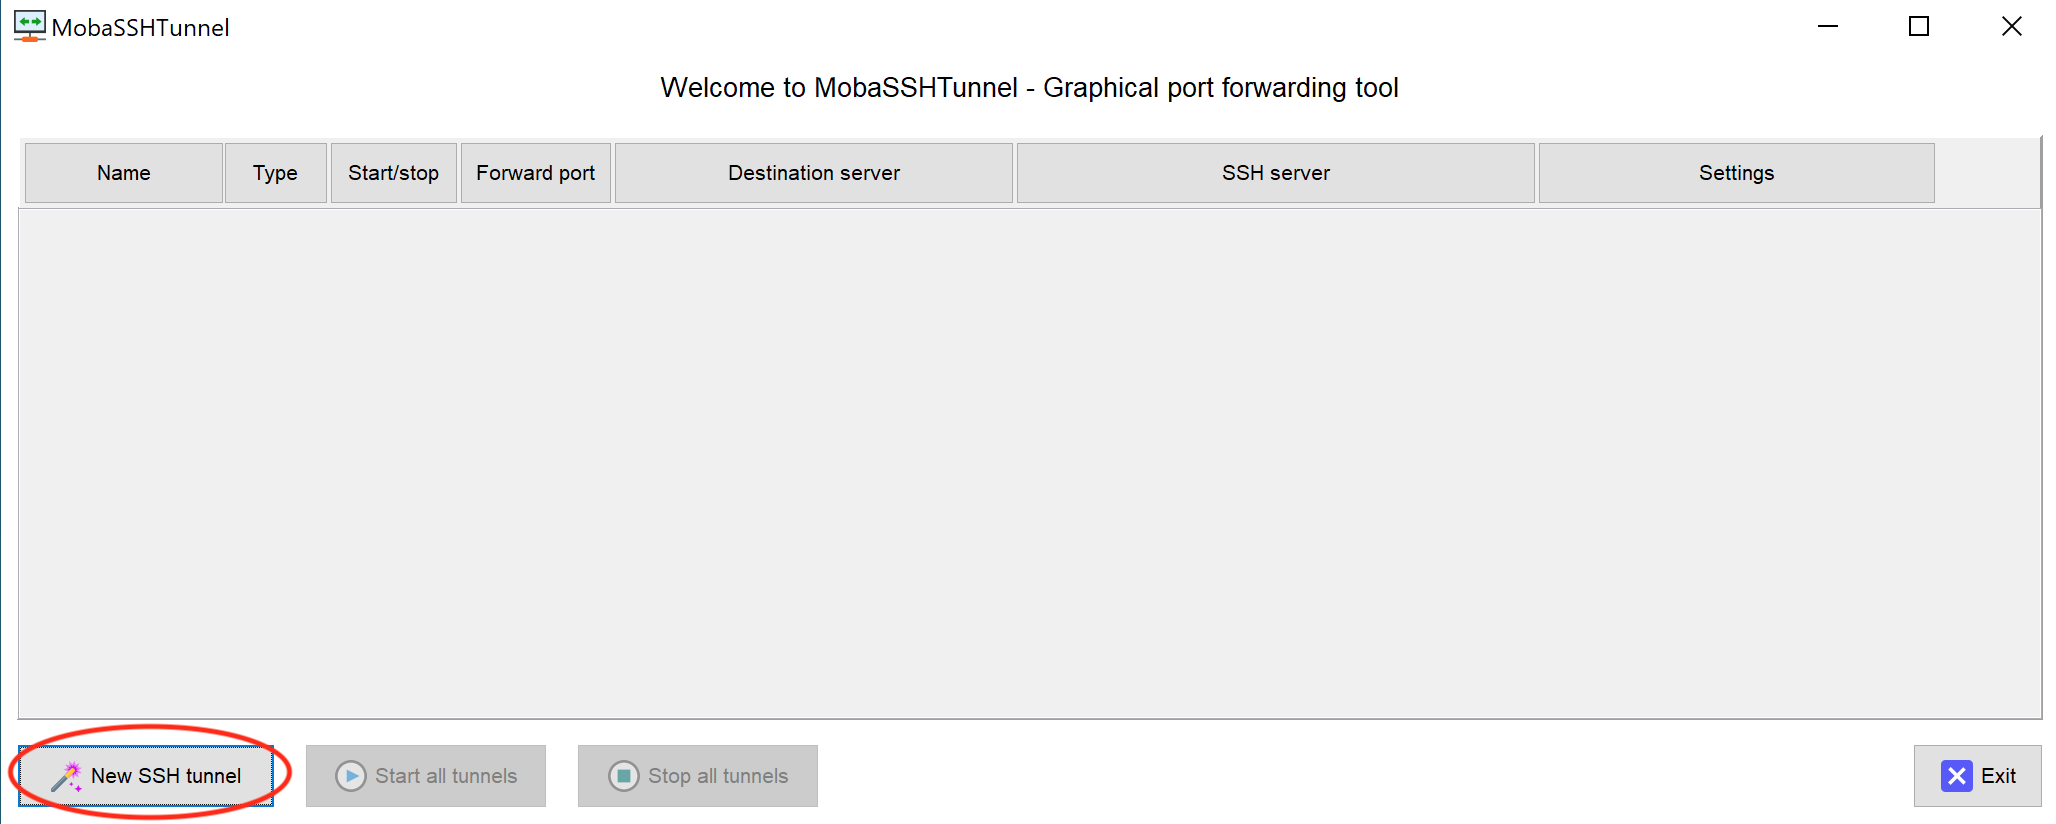
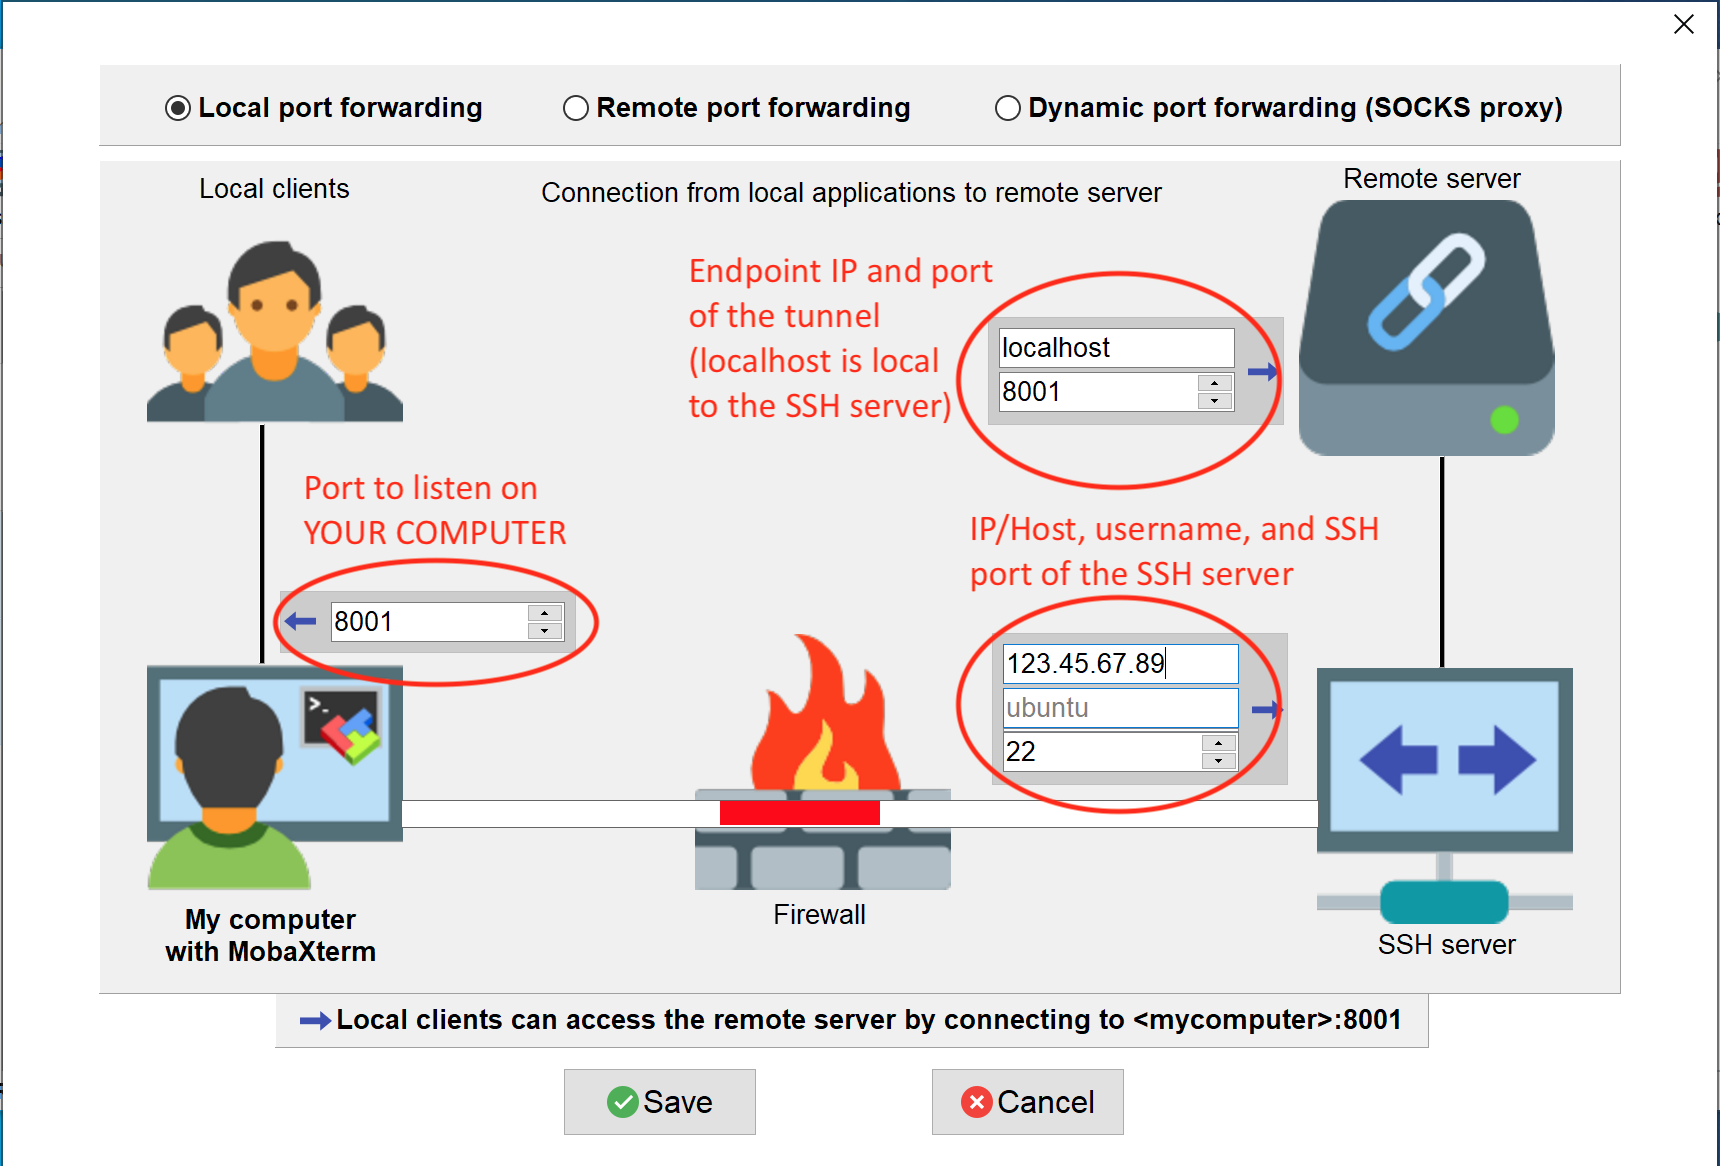
Windows users will need to configure MobaXTerm via the GUI to create and start a tunnel. See screenshots below under the Troubleshooting section.
Mac and Linux users can add the tunnel via the command line when connecting to the Kubernetes controller.
First, ensure that your SSH agent has your key loaded:
$ ssh-add -l
Example output:
2048 SHA256:NxedqqnwRMBERXGiD7y6q6x5nwny3C/AlhqMjBhJRos COMP-175-Lab-1.pem (RSA)
Second, open an SSH connection to the Kubernetes controller, and enable port forwarding while doing so:
$ ssh -A -L 8001:localhost:8001 ubuntu@IP-OF-K8S-CONTROLLER
-Awill use the agent to manage keys (not needed, but always nice, right?)-Ldoes port forwarding with the syntax:
Local Port (YOUR computer) : Remote Host (from perspective of server) : Remote Port (from perspective of server)
Once you have a SSH local port forwarding tunnel established between your computer and the Kubernetes controller, go back to the terminal of the k8s-controller and create a secure channel into the cluster:
k8s-controller$ kubectl proxy
# Leave this RUNNING!
# The proxy must be ACTIVE for the dashboard to be reachable in your web browser
Finally, back on your computer, use your web browser to access the dashboard at http://localhost:8001/api/v1/namespaces/kubernetes-dashboard/services/https:kubernetes-dashboard:/proxy/. Once the "Kubernetes Dashboard" page loads, choose "Token" as your authentication option, and paste in the token you created previously for access. Select "Sign in" to enter the Dashboard.
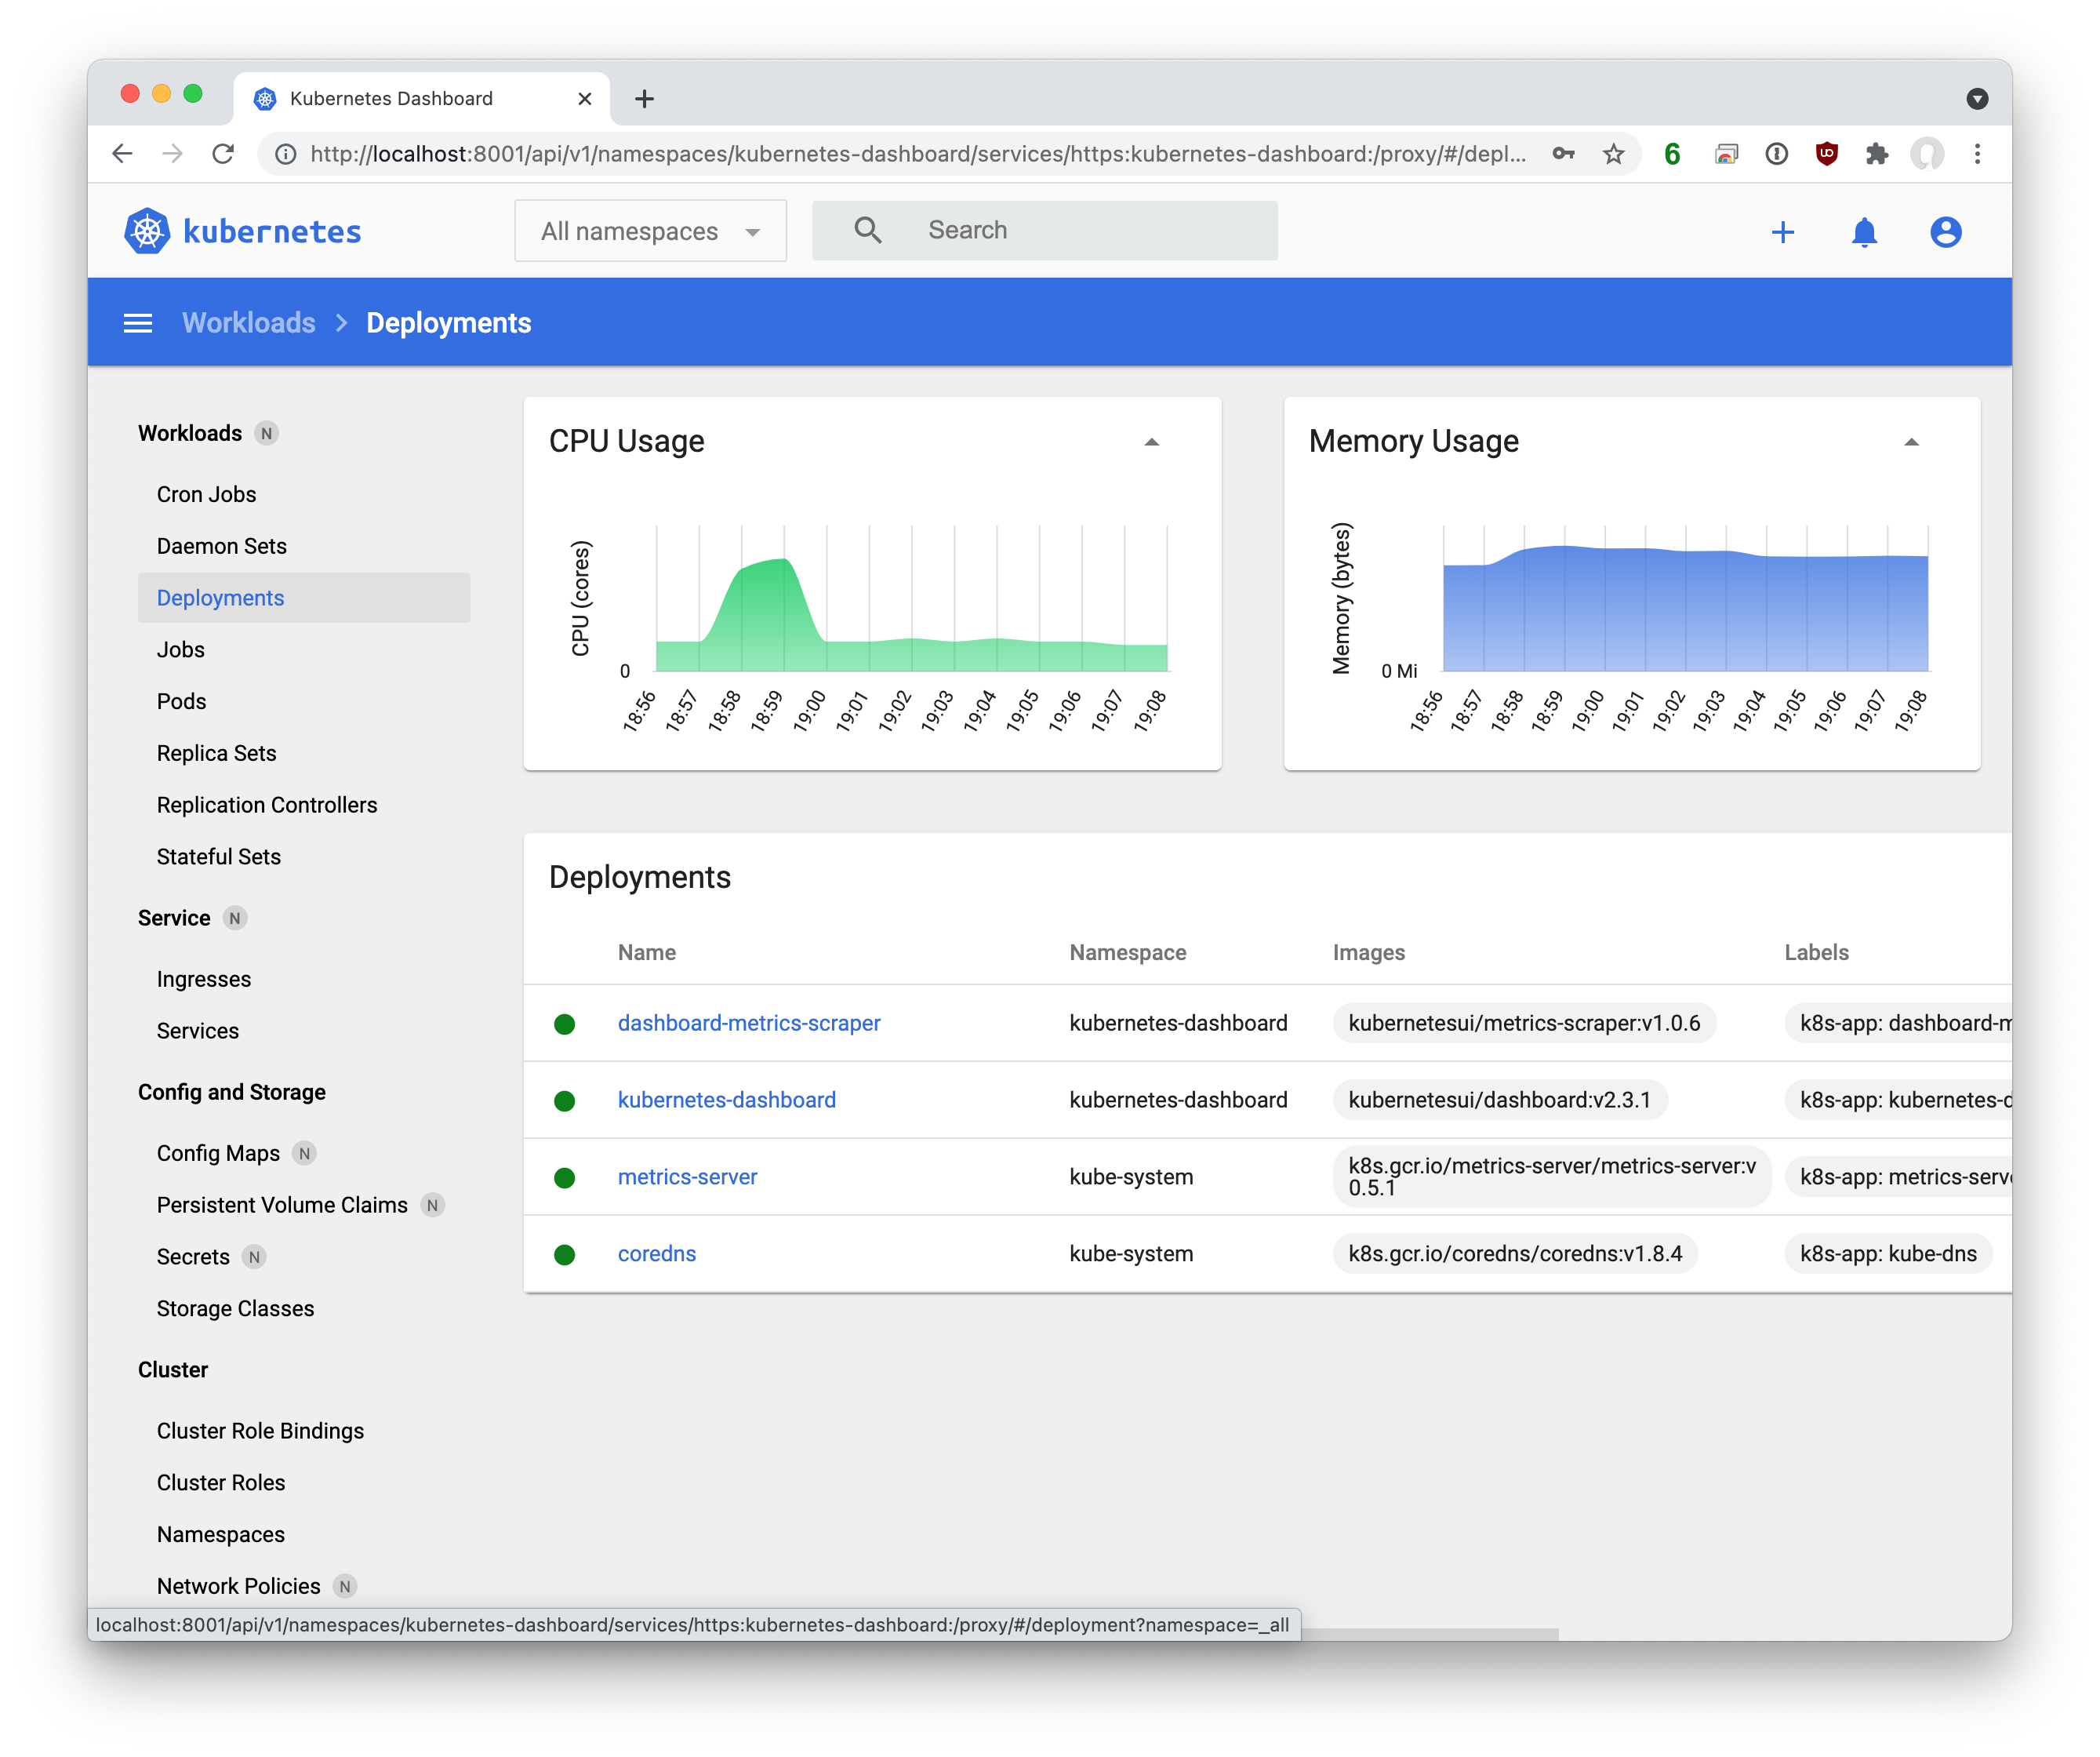
Deliverables:
- Submit a screenshot of the Dashboard in your web browser showing current cluster status.
(Tip: Change the Namespace dropdown from "Default" to "All Namespaces" to see more)
Troubleshooting
For Windows MobaXTerm users, configure your local port forwarding tunnel:
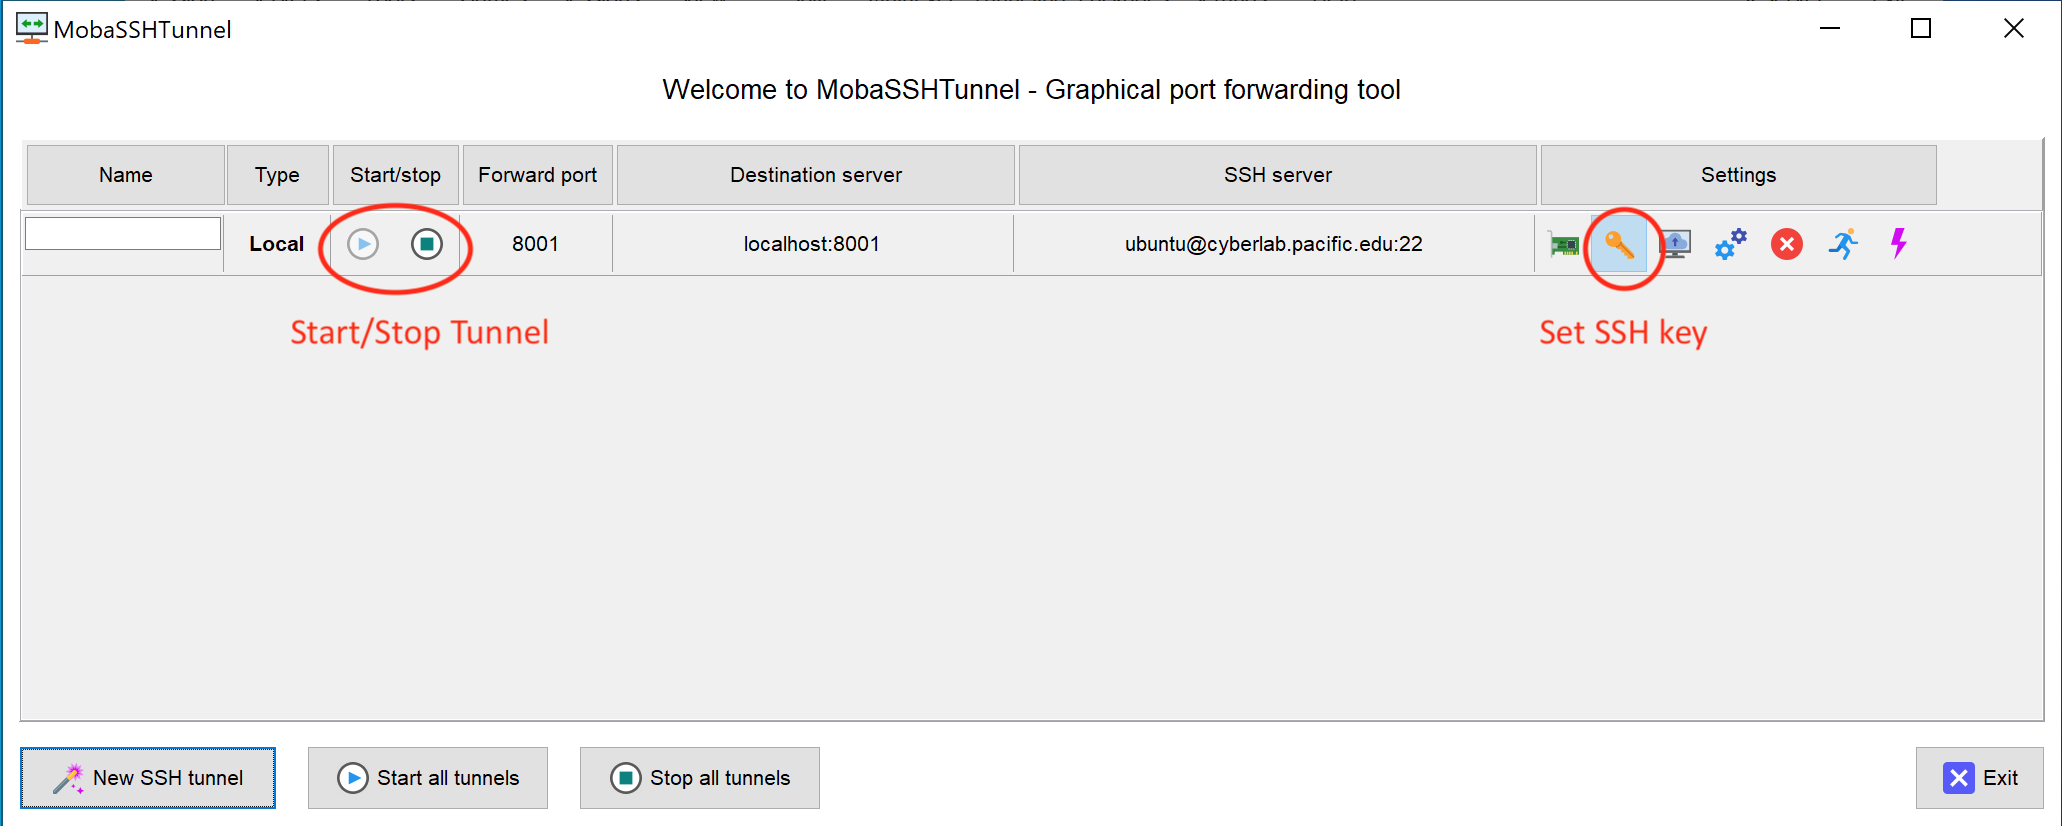
If you are unsure whether your SSH port forwarding tunnel or the Dashboard itself is at fault, try running curl on the controller node while the kubectl proxy is active (in another SSH terminal). If you get something back from the dashboard (raw html), then you can be more confident that the Dashboard is running.
k8s-controller$ kubectl proxy
# LEAVE RUNING
# In another SSH window:
k8s-controller$ curl http://localhost:8001/api/v1/namespaces/kubernetes-dashboard/services/https:kubernetes-dashboard:/proxy/
# Expected output:
<!--
Copyright 2017 The Kubernetes Authors.
Licensed under the Apache License, Version 2.0 (the "License");
you may not use this file except in compliance with the License.
You may obtain a copy of the License at
http://www.apache.org/licenses/LICENSE-2.0
Unless required by applicable law or agreed to in writing, software
distributed under the License is distributed on an "AS IS" BASIS,
WITHOUT WARRANTIES OR CONDITIONS OF ANY KIND, either express or implied.
See the License for the specific language governing permissions and
limitations under the License.
--><!DOCTYPE html><html lang="en"><head>
<meta charset="utf-8">
<title>Kubernetes Dashboard</title>
<link rel="icon" type="image/png" href="assets/images/kubernetes-logo.png">
<meta name="viewport" content="width=device-width">
<style>body,html{height:100%;margin:0;}</style><link rel="stylesheet" href="styles.f66c655a05a456ae30f8.css" media="print" onload="this.media='all'"><noscript><link rel="stylesheet" href="styles.f66c655a05a456ae30f8.css"></noscript></head>
<body>
<kd-root></kd-root>
<script src="runtime.fb7fb9bb628f2208f9e9.js" defer=""></script><script src="polyfills.49b2d5227916caf47237.js" defer=""></script><script src="scripts.72d8a72221658f3278d3.js" defer=""></script><script src="en.main.0bf75cd6c71fc0efa001.js" defer=""></script>
</body></html> Get a list of deployments and then view the log files for each deployment related to the Dashboard
k8s-controller$ kubectl get deploy --all-namespaces
k8s-controller$ kubectl logs -n kube-system deploy/metrics-server
# Logs...
k8s-controller$ kubectl logs -n kubernetes-dashboard deploy/dashboard-metrics-scraper
# Logs...
k8s-controller$ kubectl logs -n kubernetes-dashboard deploy/kubernetes-dashboard
# Logs...
Part 2 - Deploy "Hello World" Service
For this "Hello World" demo, 5 instances of an application are going to be run in containers, and then exposed as a service with a single IP address.
References:
To start, create a YAML file that defines the hello world demo. This file creates a Deployment (a replicated application) and a ReplicaSet that ensures the minimum number of replicas are always running.
apiVersion: apps/v1
kind: Deployment
metadata:
  labels:
    app.kubernetes.io/name: load-balancer-example
  name: hello-world
spec:
  replicas: 5
  selector:
    matchLabels:
      app.kubernetes.io/name: load-balancer-example
  template:
    metadata:
      labels:
        app.kubernetes.io/name: load-balancer-example
    spec:
      containers:
      - image: gcr.io/google-samples/node-hello:1.0
        name: hello-world
        ports:
        - containerPort: 8080
This file has already been created as a K8s demo. Download and apply it to the cluster:
k8s-controller$ kubectl apply -f https://k8s.io/examples/service/load-balancer-example.yamlGet information on the Deployment:
k8s-controller$ kubectl get deployments hello-world

# Example Output:
# NAME          READY   UP-TO-DATE   AVAILABLE   AGE
# hello-world   5/5     5            5           50m

k8s-controller$ kubectl describe deployments hello-world
# Example Output has much more detail....
Get information on the ReplicaSet:
k8s-controller$ kubectl get replicasets

# Example Output:
# NAME                     DESIRED   CURRENT   READY   AGE
# hello-world-6df5659cb7   5         5         5       51m

k8s-controller$ kubectl describe replicasets
# Example Output has much more detail....
At this point, the 5 replicated applications are running, but are only accessible from within their individual containers! Obviously, this does no good for a network application. Create a Service object that "exposes" the Deployment.
k8s-controller$ kubectl expose deployment hello-world --type=LoadBalancer --name=my-serviceDisplay information about the Service:
k8s-controller$ kubectl get services my-service
# Example Output:
# NAME         TYPE           CLUSTER-IP     EXTERNAL-IP   PORT(S)          AGE
# my-service   LoadBalancer   10.97.91.129   <pending>     8080:30178/TCP   55m
The EXTERNAL-IP is not yet connected to the AWS Load Balancer, and thus will always be pending. However, the CLUSTER-IP is accessible from any node within the Kubernetes cluster. Use the curl data transfer program to connect to CLUSTER-IP on all nodes and ensure that the demo "page" loads. When testing, replace CLUSTER-IP with the specific IP address shown in the kubectl get services my-service command.
# Test from the Controller node:
k8s-controller$ curl http://CLUSTER-IP:8080
# Hello Kubernetes!

# Test from the Worker01 node:
k8s-worker01$ curl http://CLUSTER-IP:8080
# Hello Kubernetes!

# Test from the Worker02 node:
k8s-worker02$ curl http://CLUSTER-IP:8080
# Hello Kubernetes!
Deliverables:
- Submit a screenshot of
Hello Kubernetes!when loading theCLUSTER-IPfrom all three cluster nodes. (This demonstrates that the application is exposed, and that the cross-cluster networking via Flannel is functional). - Submit a screenshot of the Dashboard -> Workload -> Deployments -> Hello World showing the deployment information.
- Submit screenshot(s) of the Dashboard -> Services -> my-service showing the service information, including the 5 endpoints and the 5 pods.
To view extended information about this particular service, as well as see the specific pods where the applications are running, do:
k8s-controller$ kubectl describe services my-service
k8s-controller$ kubectl get pods --output=wide
When finished, to clean up, first delete the Service:
k8s-controller$ kubectl delete services my-serviceThen delete the Deployment, ReplicaSet, and the Pods that are running the Hello World application:
k8s-controller$ kubectl delete deployment hello-worldLab Deliverables
After submitting the Canvas assignment, you should STOP your virtual machines, not terminate them. We'll use them again in future labs, and thus want to save the configuration and OS data.
Upload to the Lab 12 Canvas assignment all the lab deliverables to demonstrate your work:
- Part 1 - Install Kubernetes
- Submit a screenshot of the output of
kubectl top nodesandkubectl top pods --all-namespacesshowing cluster CPU and memory utilization. - Submit a screenshot of the Dashboard in your web browser showing current cluster status.
- Submit a screenshot of the output of
- Part 2 - Deploy "Hello World" Service
- Submit a screenshot of
Hello Kubernetes!when loading theCLUSTER-IPfrom all three cluster nodes. (This demonstrates that the application is exposed, and that the cross-cluster networking via Flannel is functional). - Submit a screenshot of the Dashboard -> Workload -> Deployments -> Hello World showing the deployment information.
- Submit screenshot(s) of the Dashboard -> Services -> my-service showing the service information, including the 5 endpoints and the 5 pods.
- Submit a screenshot of