Lab Network Monitoring
Design Overview
The goal is to implement a system for capturing and analyzing laboratory network traffic. Data collected includes full packet capture (PCAP), flow summary data (NetFlow), log files for key network services, and protocol specific data. The router’s built in tool is used to capture a livestream of PCAP and NetFlow data. Moloch is used to analyze PCAP data, SOF-ELK is used to analyze NetFlow and log files data, and Ntopng is used for a real-time view of NetFlow traffic.
Summary
| Tool | Purpose | Data Source | Link |
|---|---|---|---|
| Real-Time Monitoring | External Probes | HTTPS Measurements - Public | |
| Real-Time Monitoring | External Probes | HTTPS Measurements - Public | |
| Real-Time Monitoring | External Probes | Ping Measurements - Public | |
| Real-Time Monitoring | External Probes | Traceroute Measurements - Public | |
 |
Forensics & Analysis | Full Packet Capture | Moloch - Lab network/VPN only |
| Forensics & Analysis | NetFlow | SOF-ELK - Lab network/VPN only | |
 |
Real-Time Monitoring | NetFlow | Ntopng - Lab network/VPN only |
Data Capture Interface
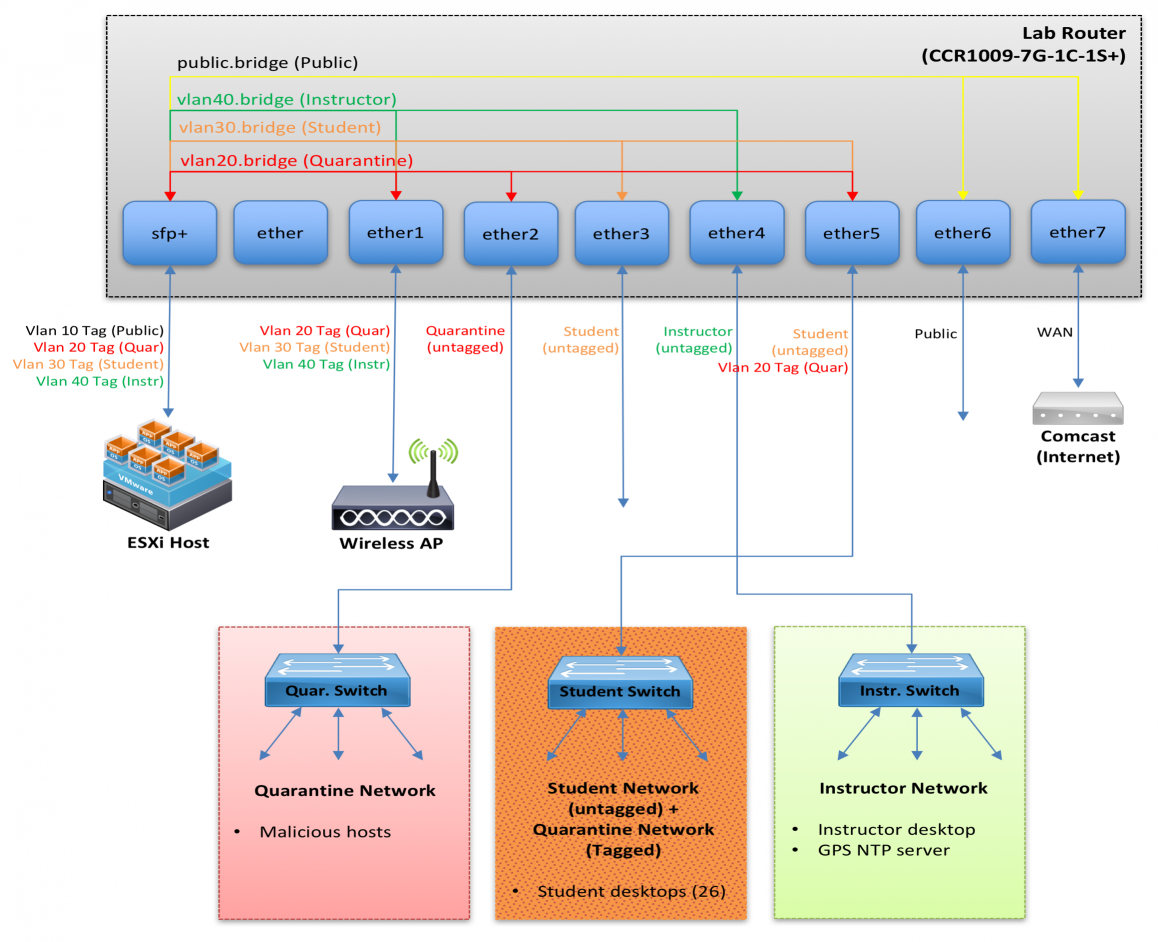
Figure 1: Laboratory Network Design
Figure 1 shows the laboratory network design. The quarantine network and public network will be monitored using the quarantine bridge interface (vlan20.bridge) and public bridge interface (public.bridge). We used the Mikrotik CCR1009 router’s built in tool for capturing and sending PCAP and NetFlow data.
ESXi Virtual Machines
We use three virtual machine ESXi host that are connected to the instructor VLAN (over the SFP+ interface). The first virtual machine runs Moloch assigned to IP address 10.1.40.5:8005 with port 80 redirected to 8005, listening on udp port 37008 for PCAP data from the router. The second virtual machine runs SOF-ELK assigned to IP address 10.1.40.6:5601 with port 80 redirected to 5601, listening on udp port 9995 for NetFlow (v5) data from the router. The third virtual machine runs Ntopng assigned to IP address 10.1.40.8, listening on port 2055 for NetFlow (v9) data from the router.
Analysis Tools
Moloch
Moloch is an open source, large scale, full packet capturing, indexing, and database system. Moloch is designed to listen for packets
directly from a network interface. However, the 'network tap' we are using (MainRouter) is a separate device, and using a SPAN/MIRROR port was not
feasible. As an alternative, the router sends packets to the Moloch server using the TaZmen Sniffer Protocol (TZSP). A small program on the Moloch server (tazman-listener) receives the TaZmen stream and writes out the original packets to PCAP files in /data/moloch/raw. A Moloch Capture process then monitors that folder, and reads in the packets whenever that PCAP file closes (currently every 10k packets). The back-end database is ElasticSearch, and the web interface is provided by Moloch Viewer.
Download: tazman-listener.zip
URL: http://10.1.40.5

Figure 2: Session Dashboard
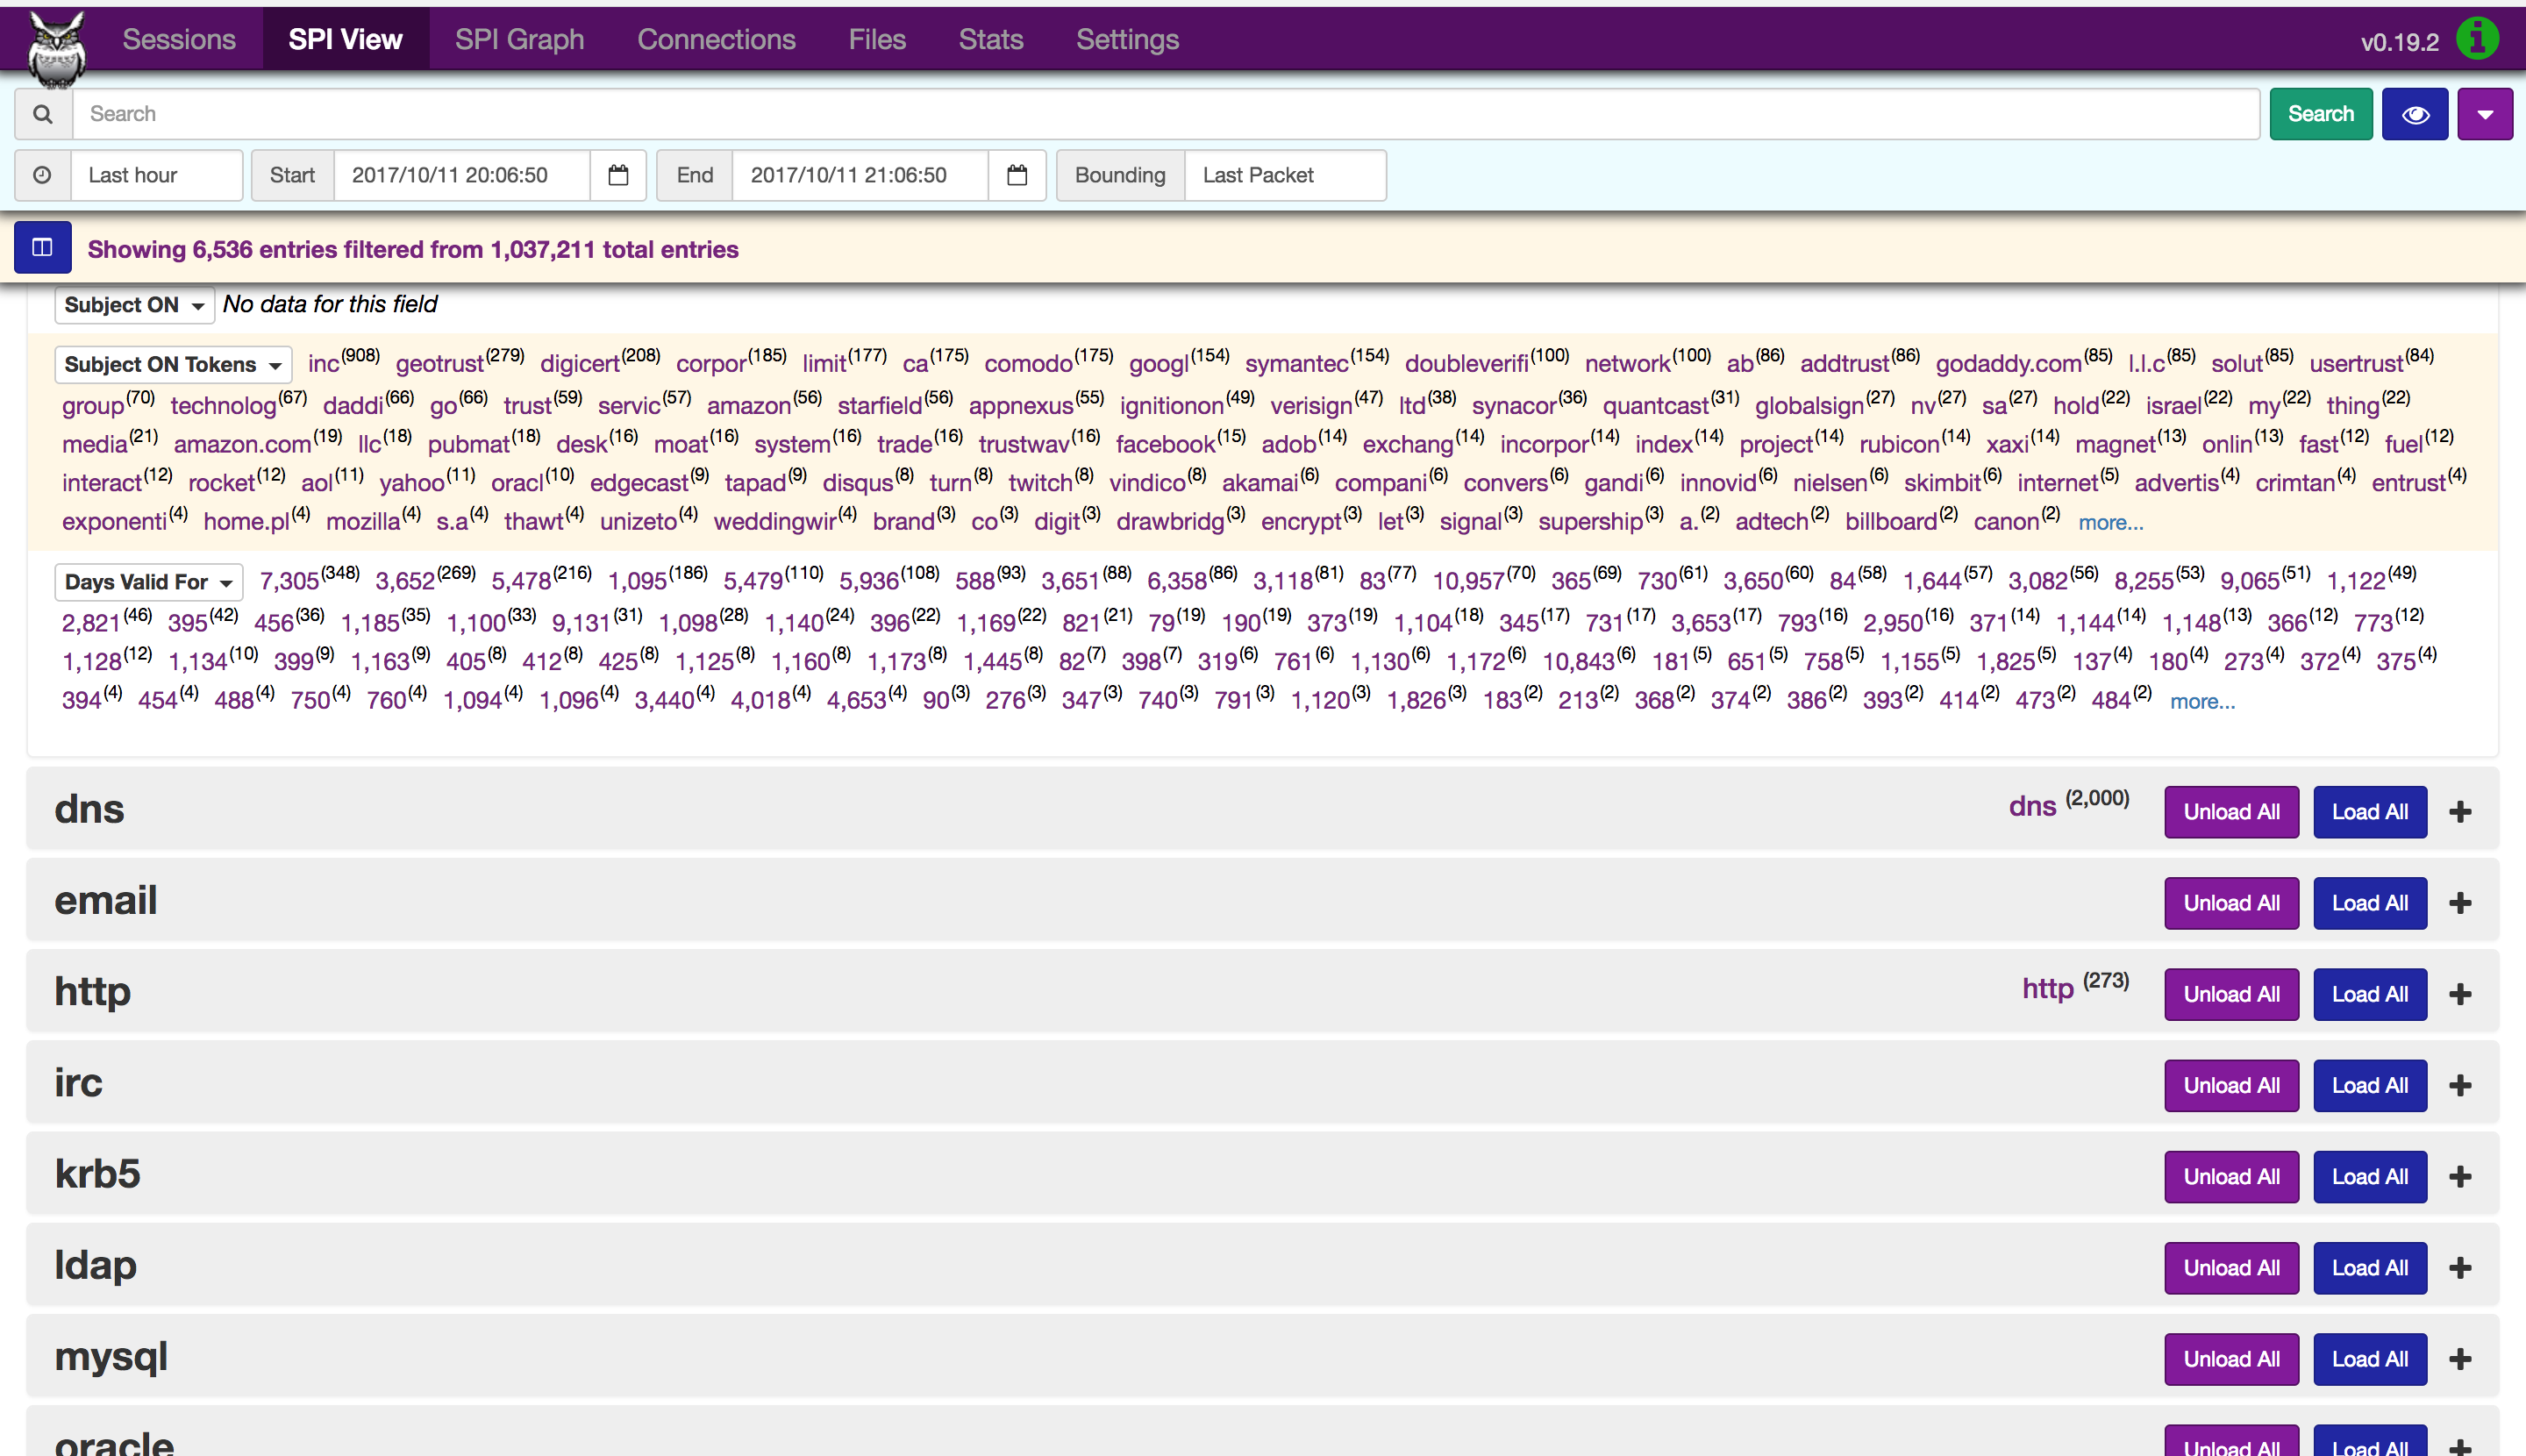
Figure 3: SPI View Dashboard
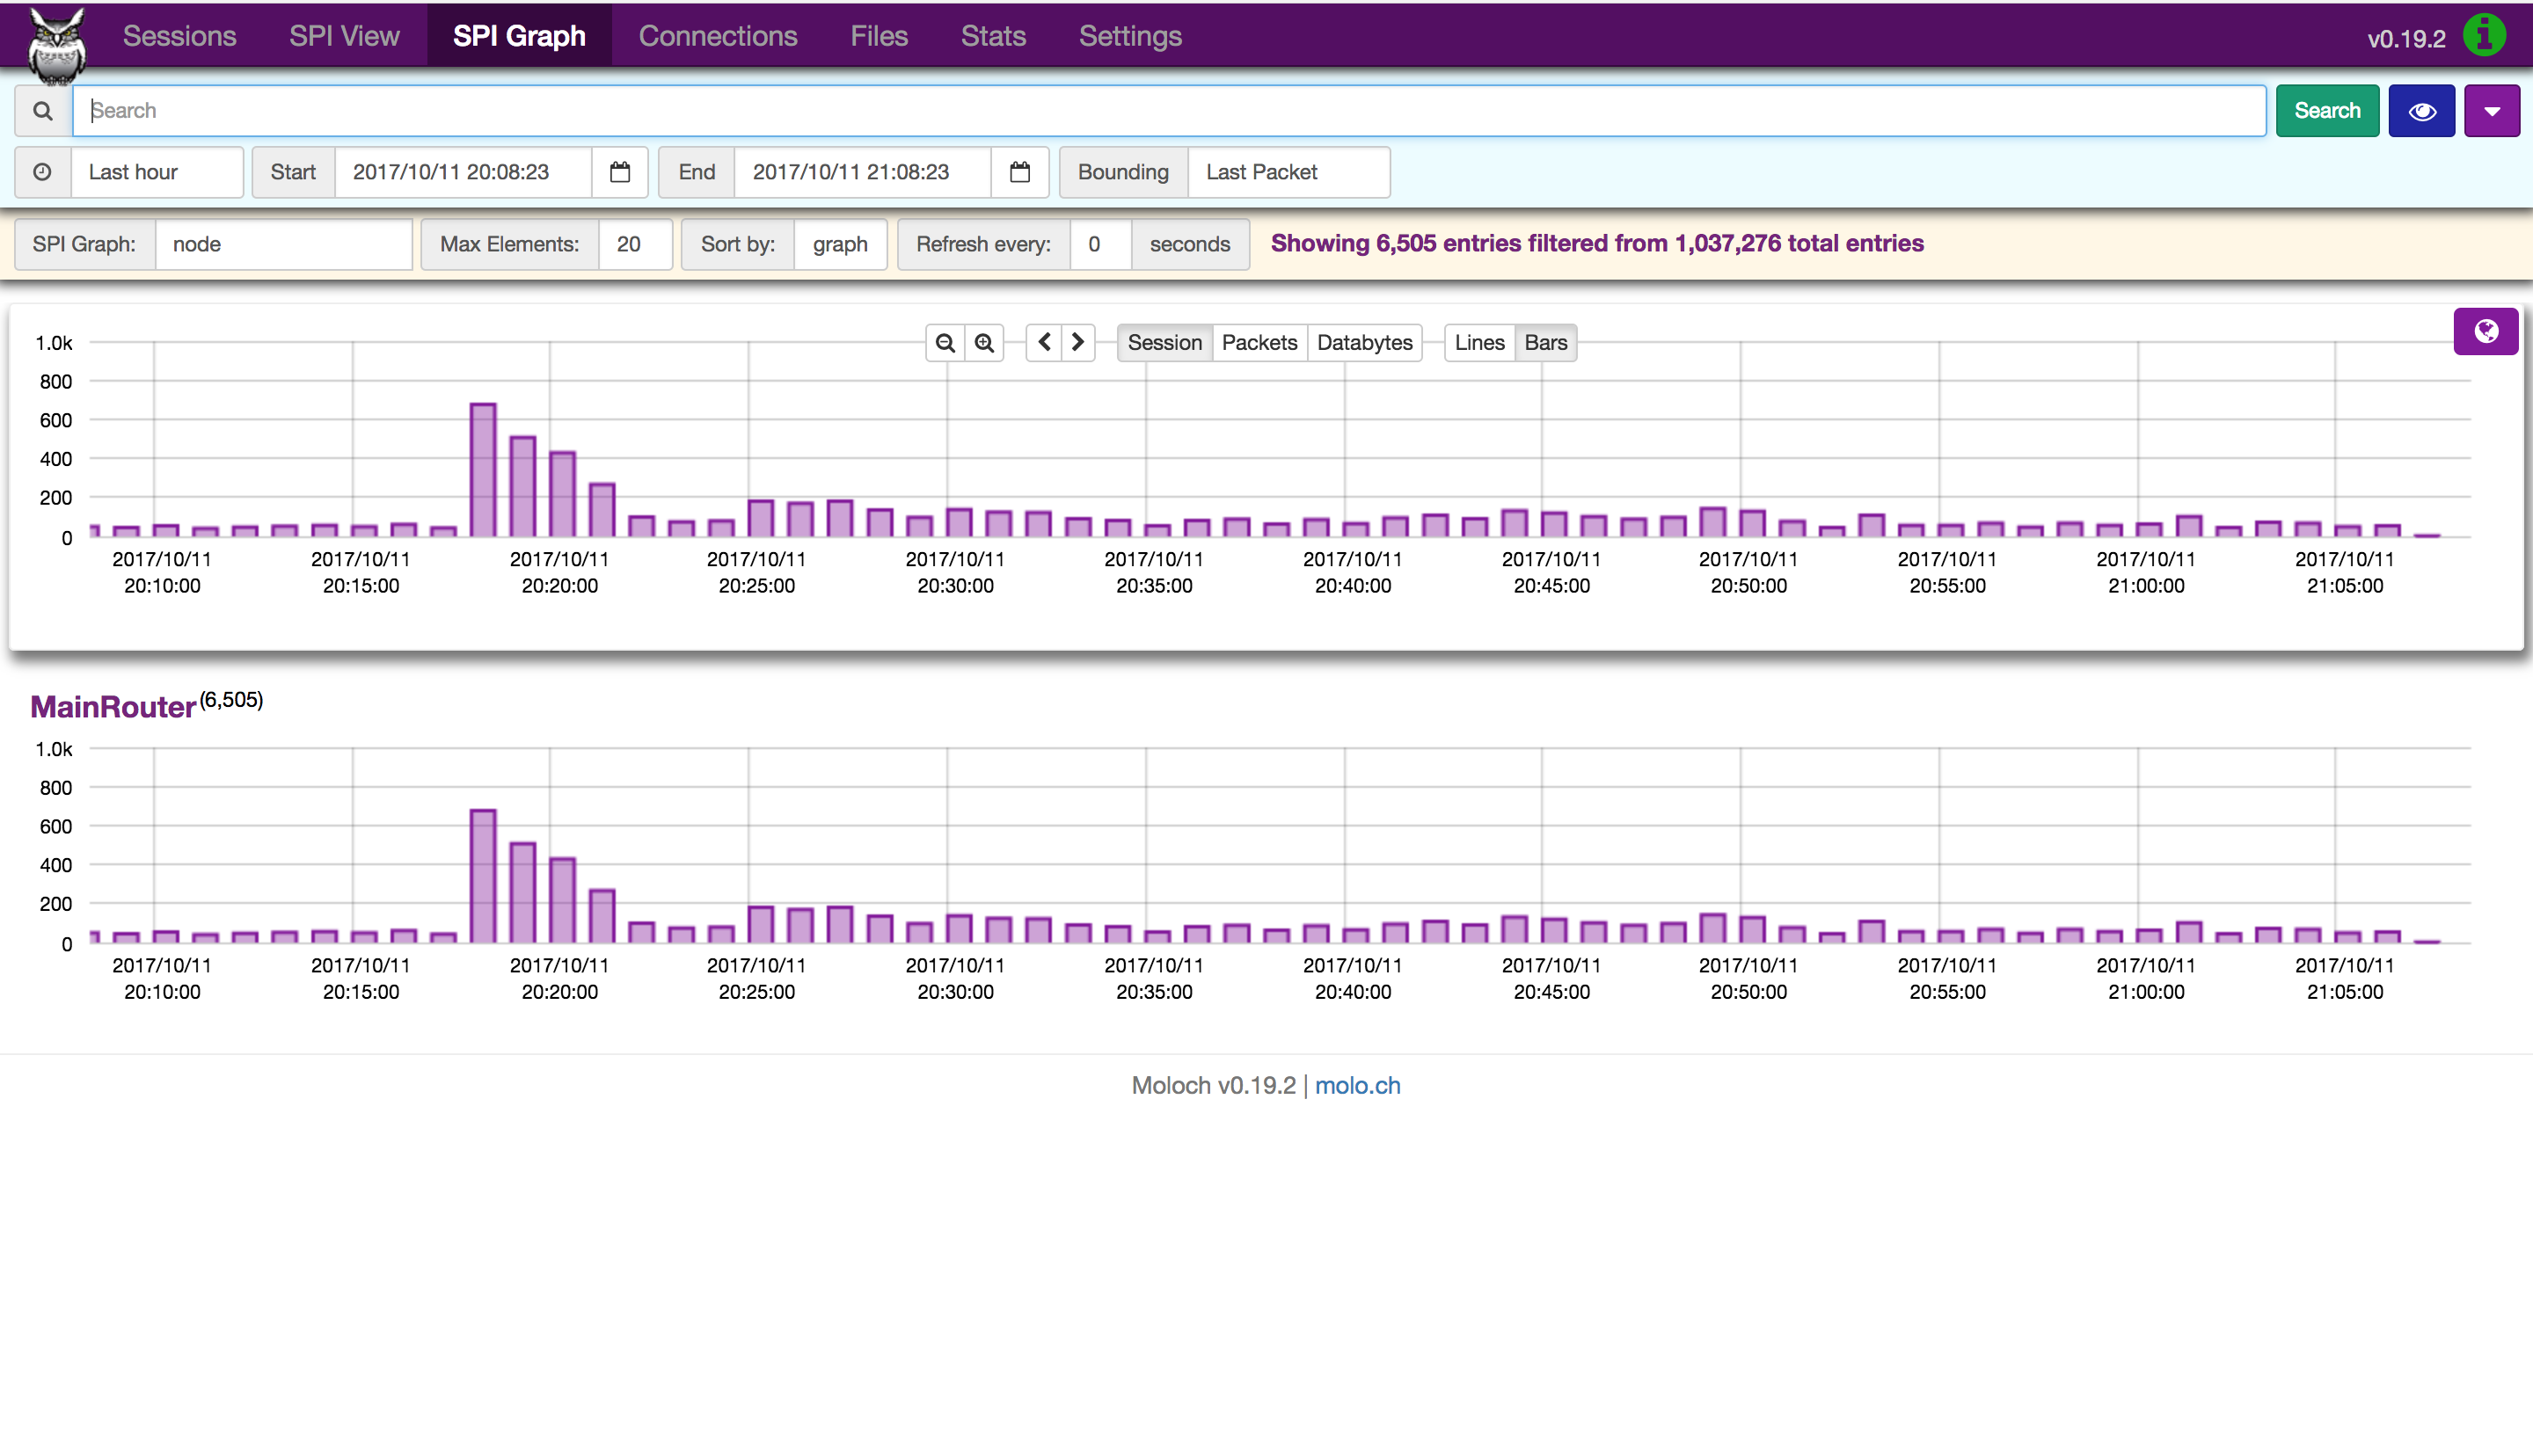
Figure 4: SPI Graph Dashboard
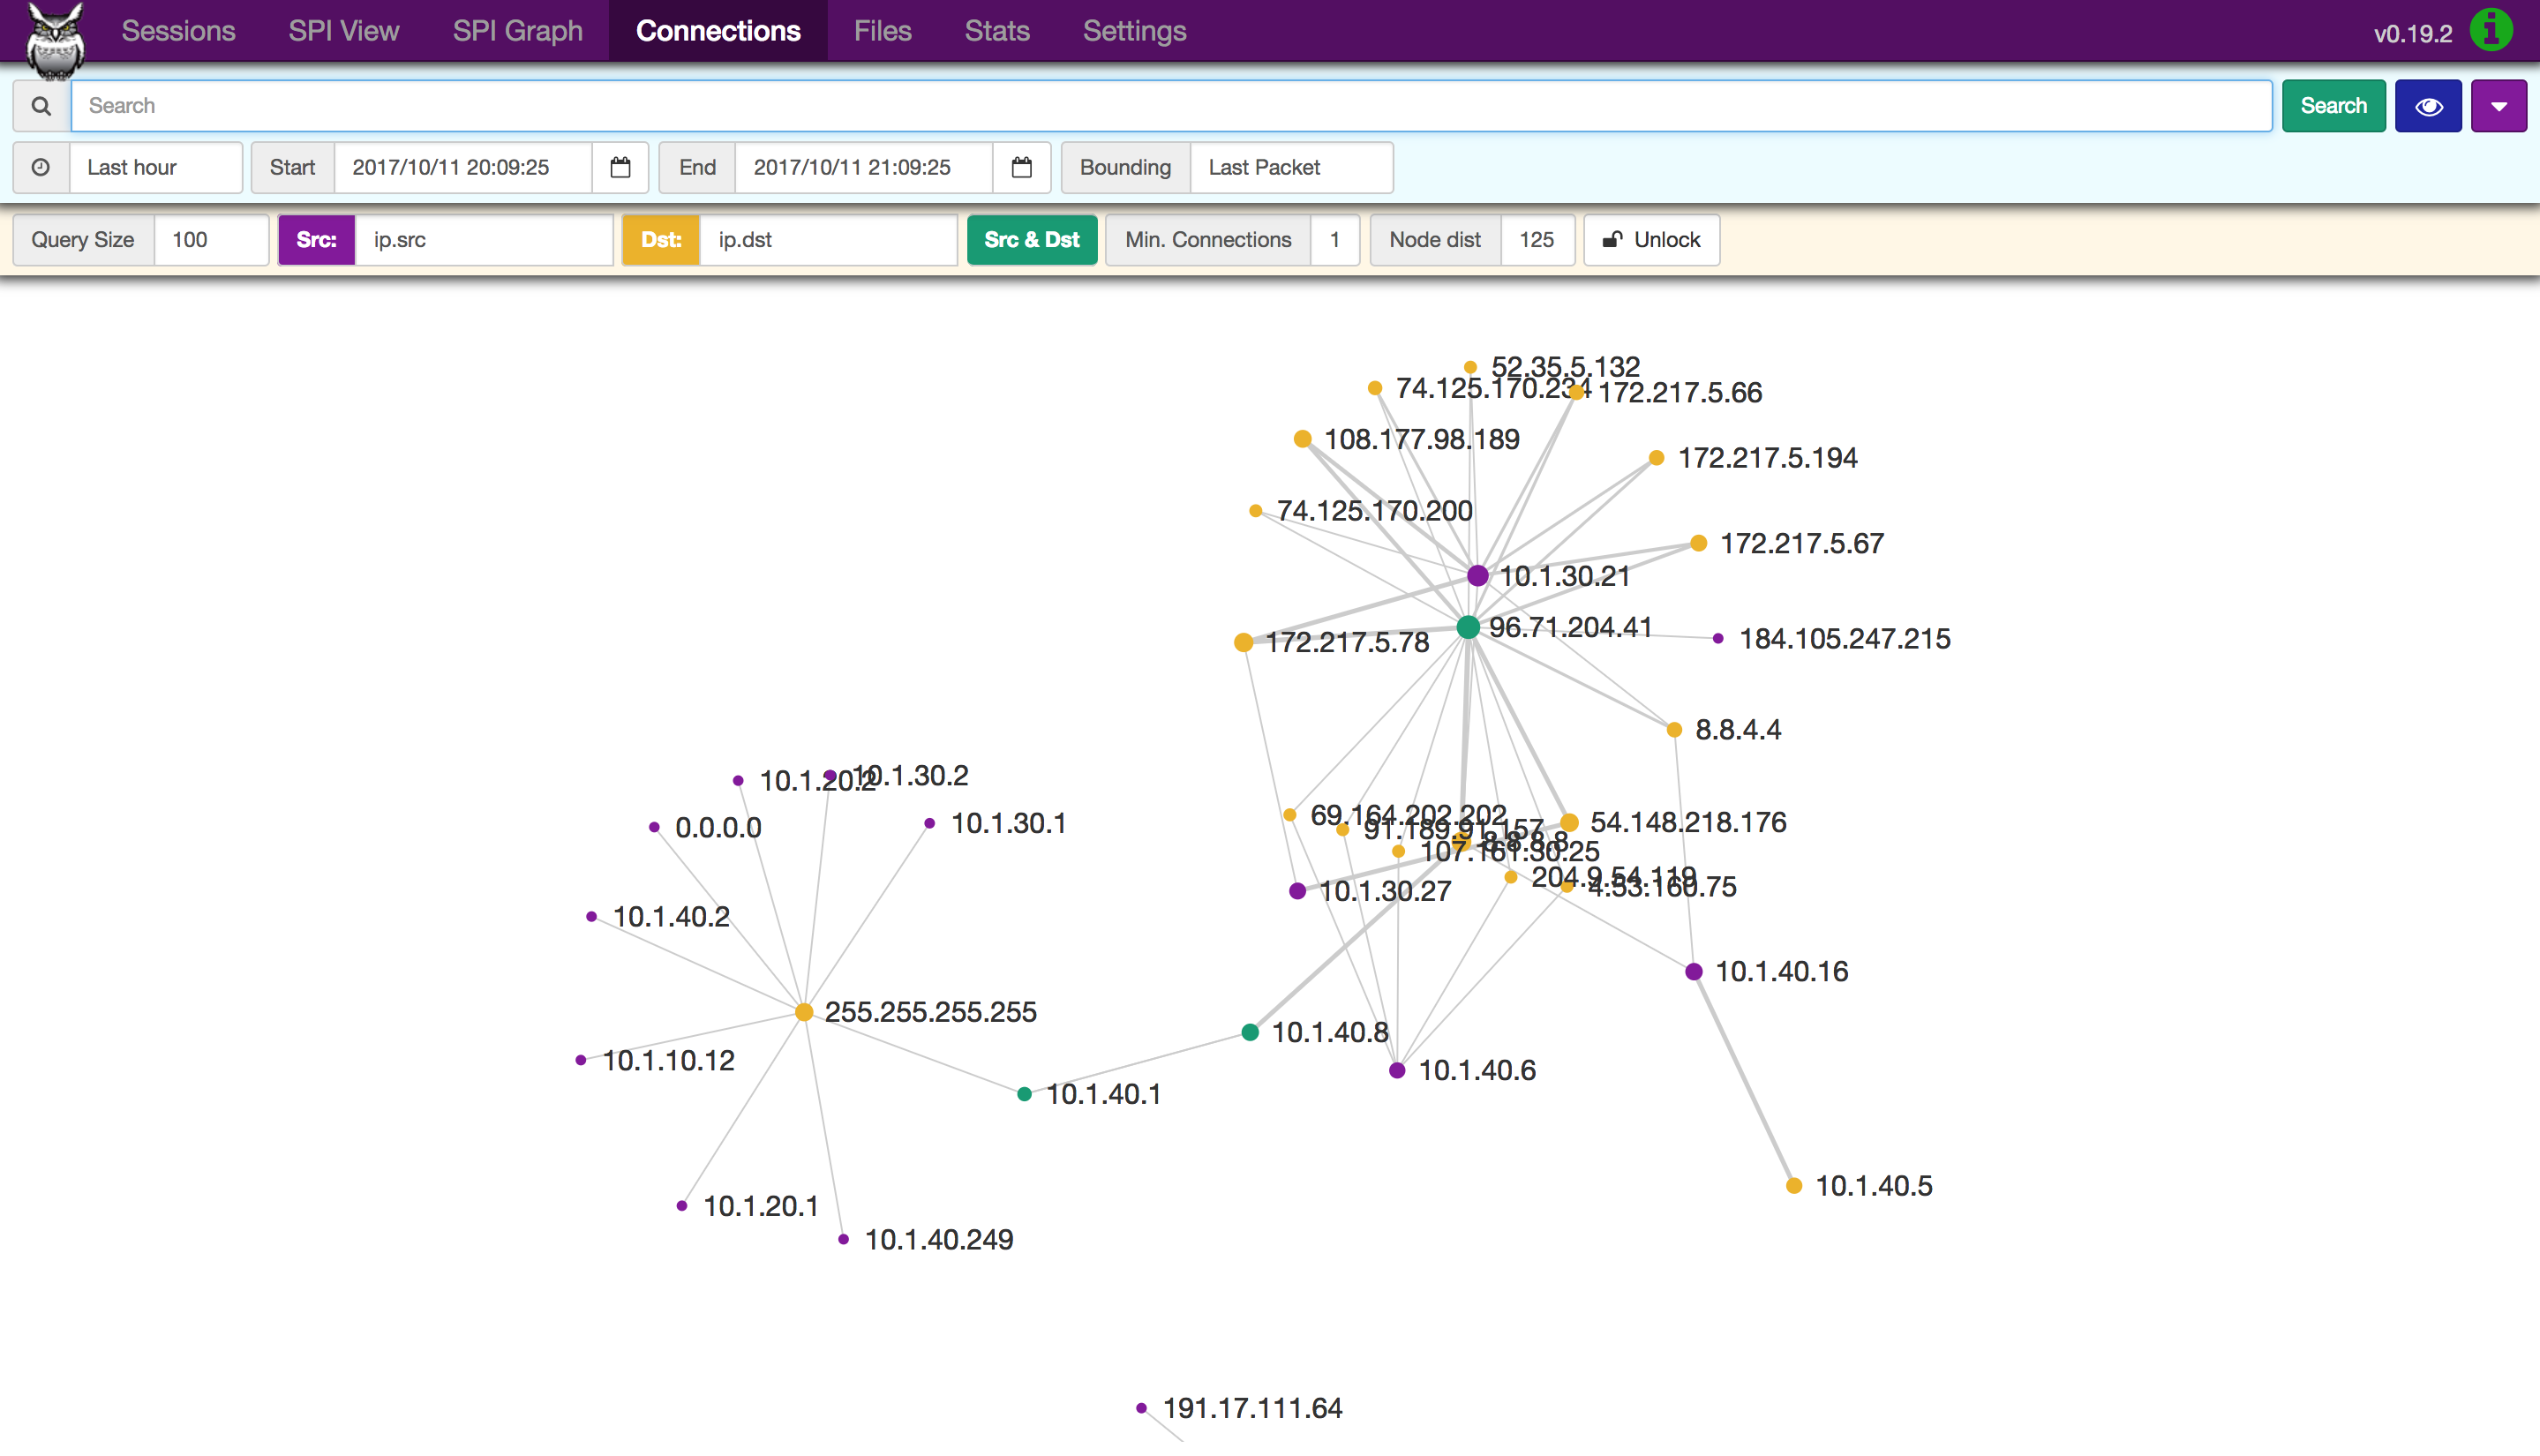
Figure 5: SPI Connection Dashboard

Figure 6: Stats Dashboard
SOF-ELK
SOF-ELK uses ElasticSearch, Logstash, and Kibana to organize and display NetFlow and network log files data. ElasticSearch is a search engine that provides a distributed, multi-tenant-capable full-text search with an HTTP web interface and schema-free JSON documents. Logstash provides an input stream to Elastic for storage and search. Kibana is used to access and display the data for visualizations, using graphs and dashboards, through a web interface.
URL: http://10.1.40.6
NetFlow Dashboard: http://10.1.40.6/app/kibana#/dashboard/NetFlow-Dashboard
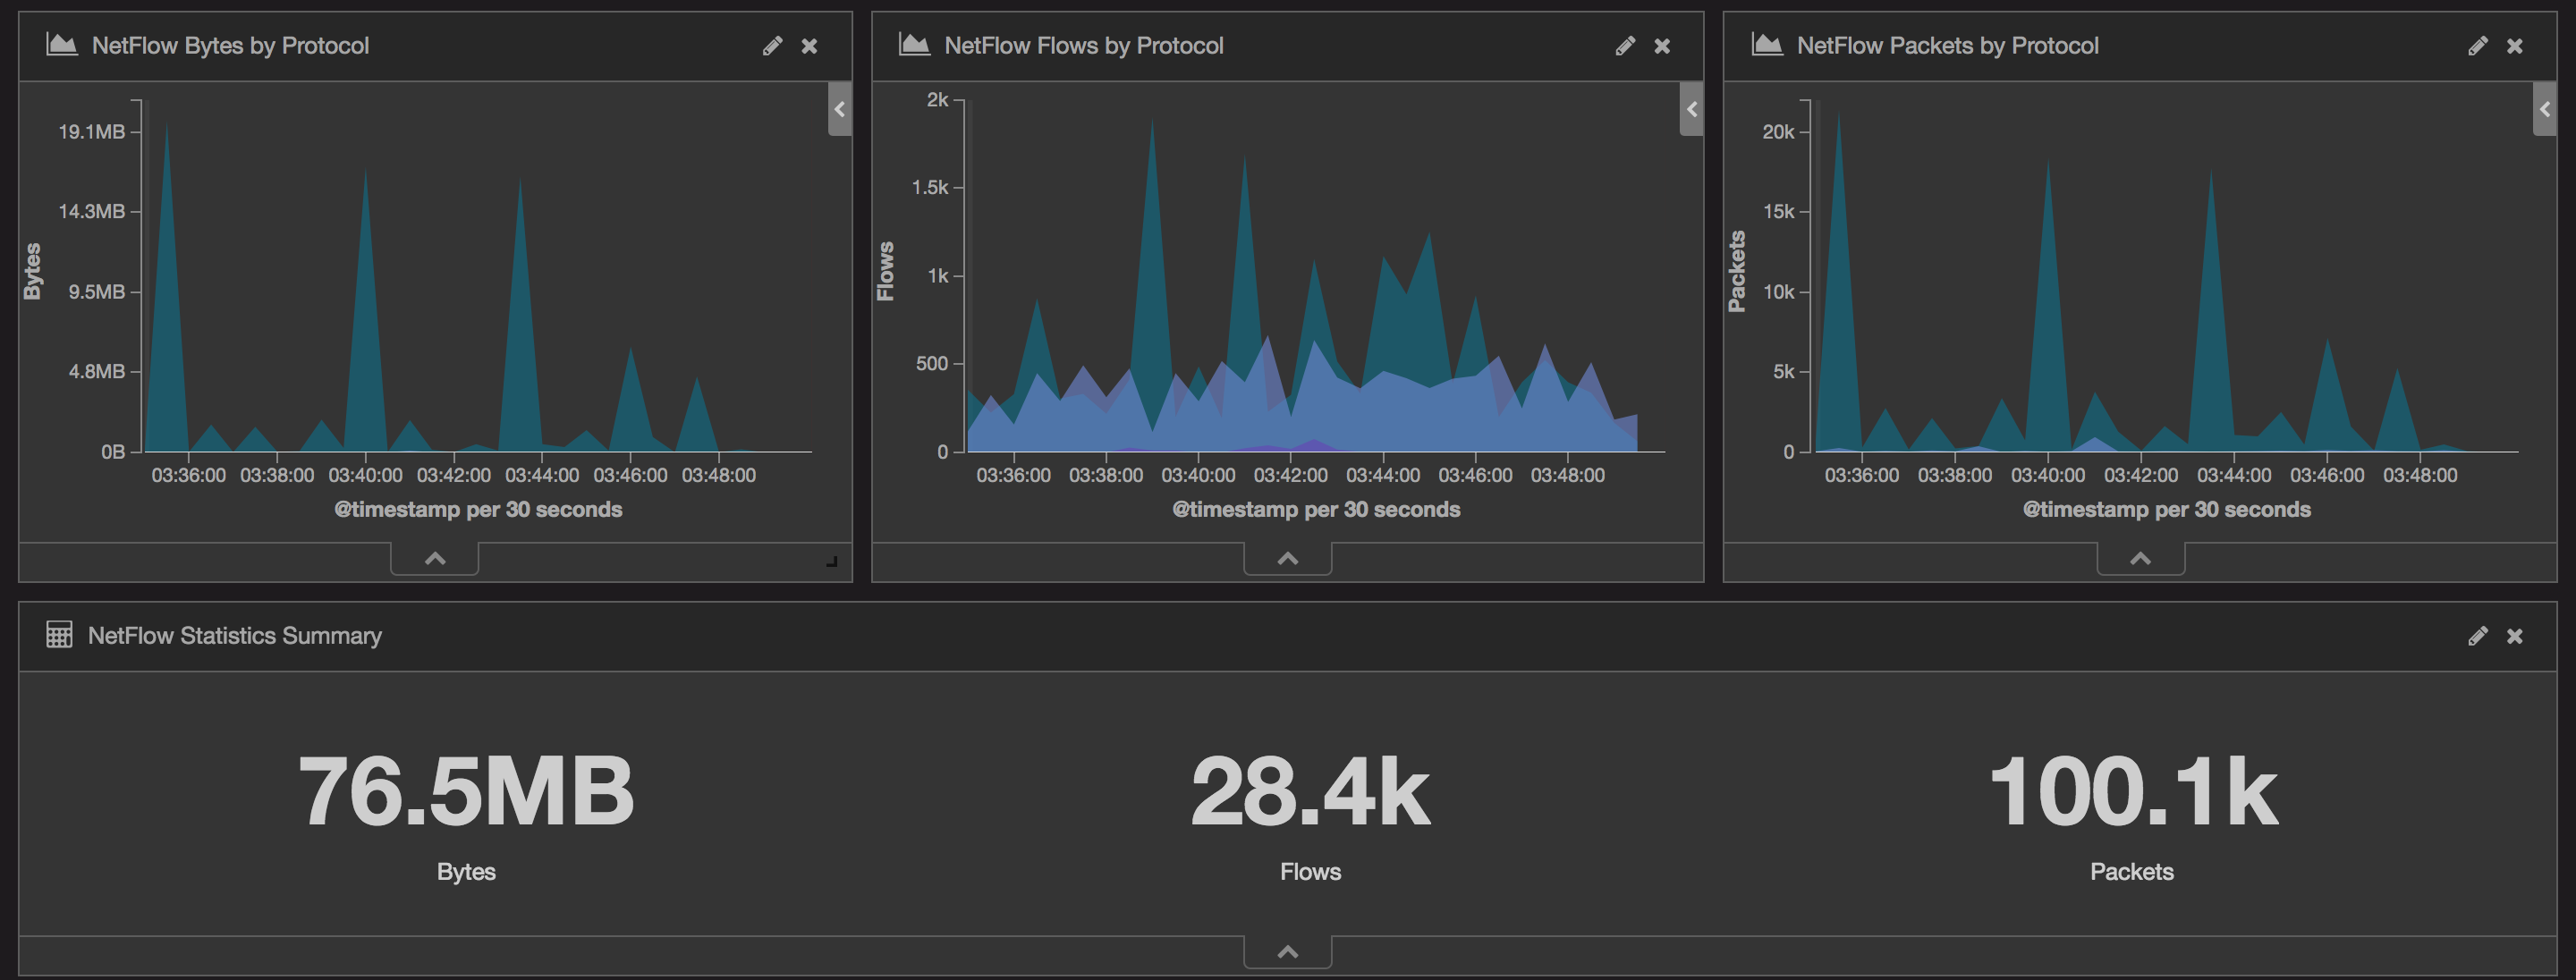
Figure 7: NetFlow Dashboard for Bytes, Flows, and Packets by Protocol, and Statistics Summary

Figure 8: NetFlow Dashboards for Statistics by Source and Destination IP, Map of Traffic to Source and Destination, and Volume by Source and Destination Port
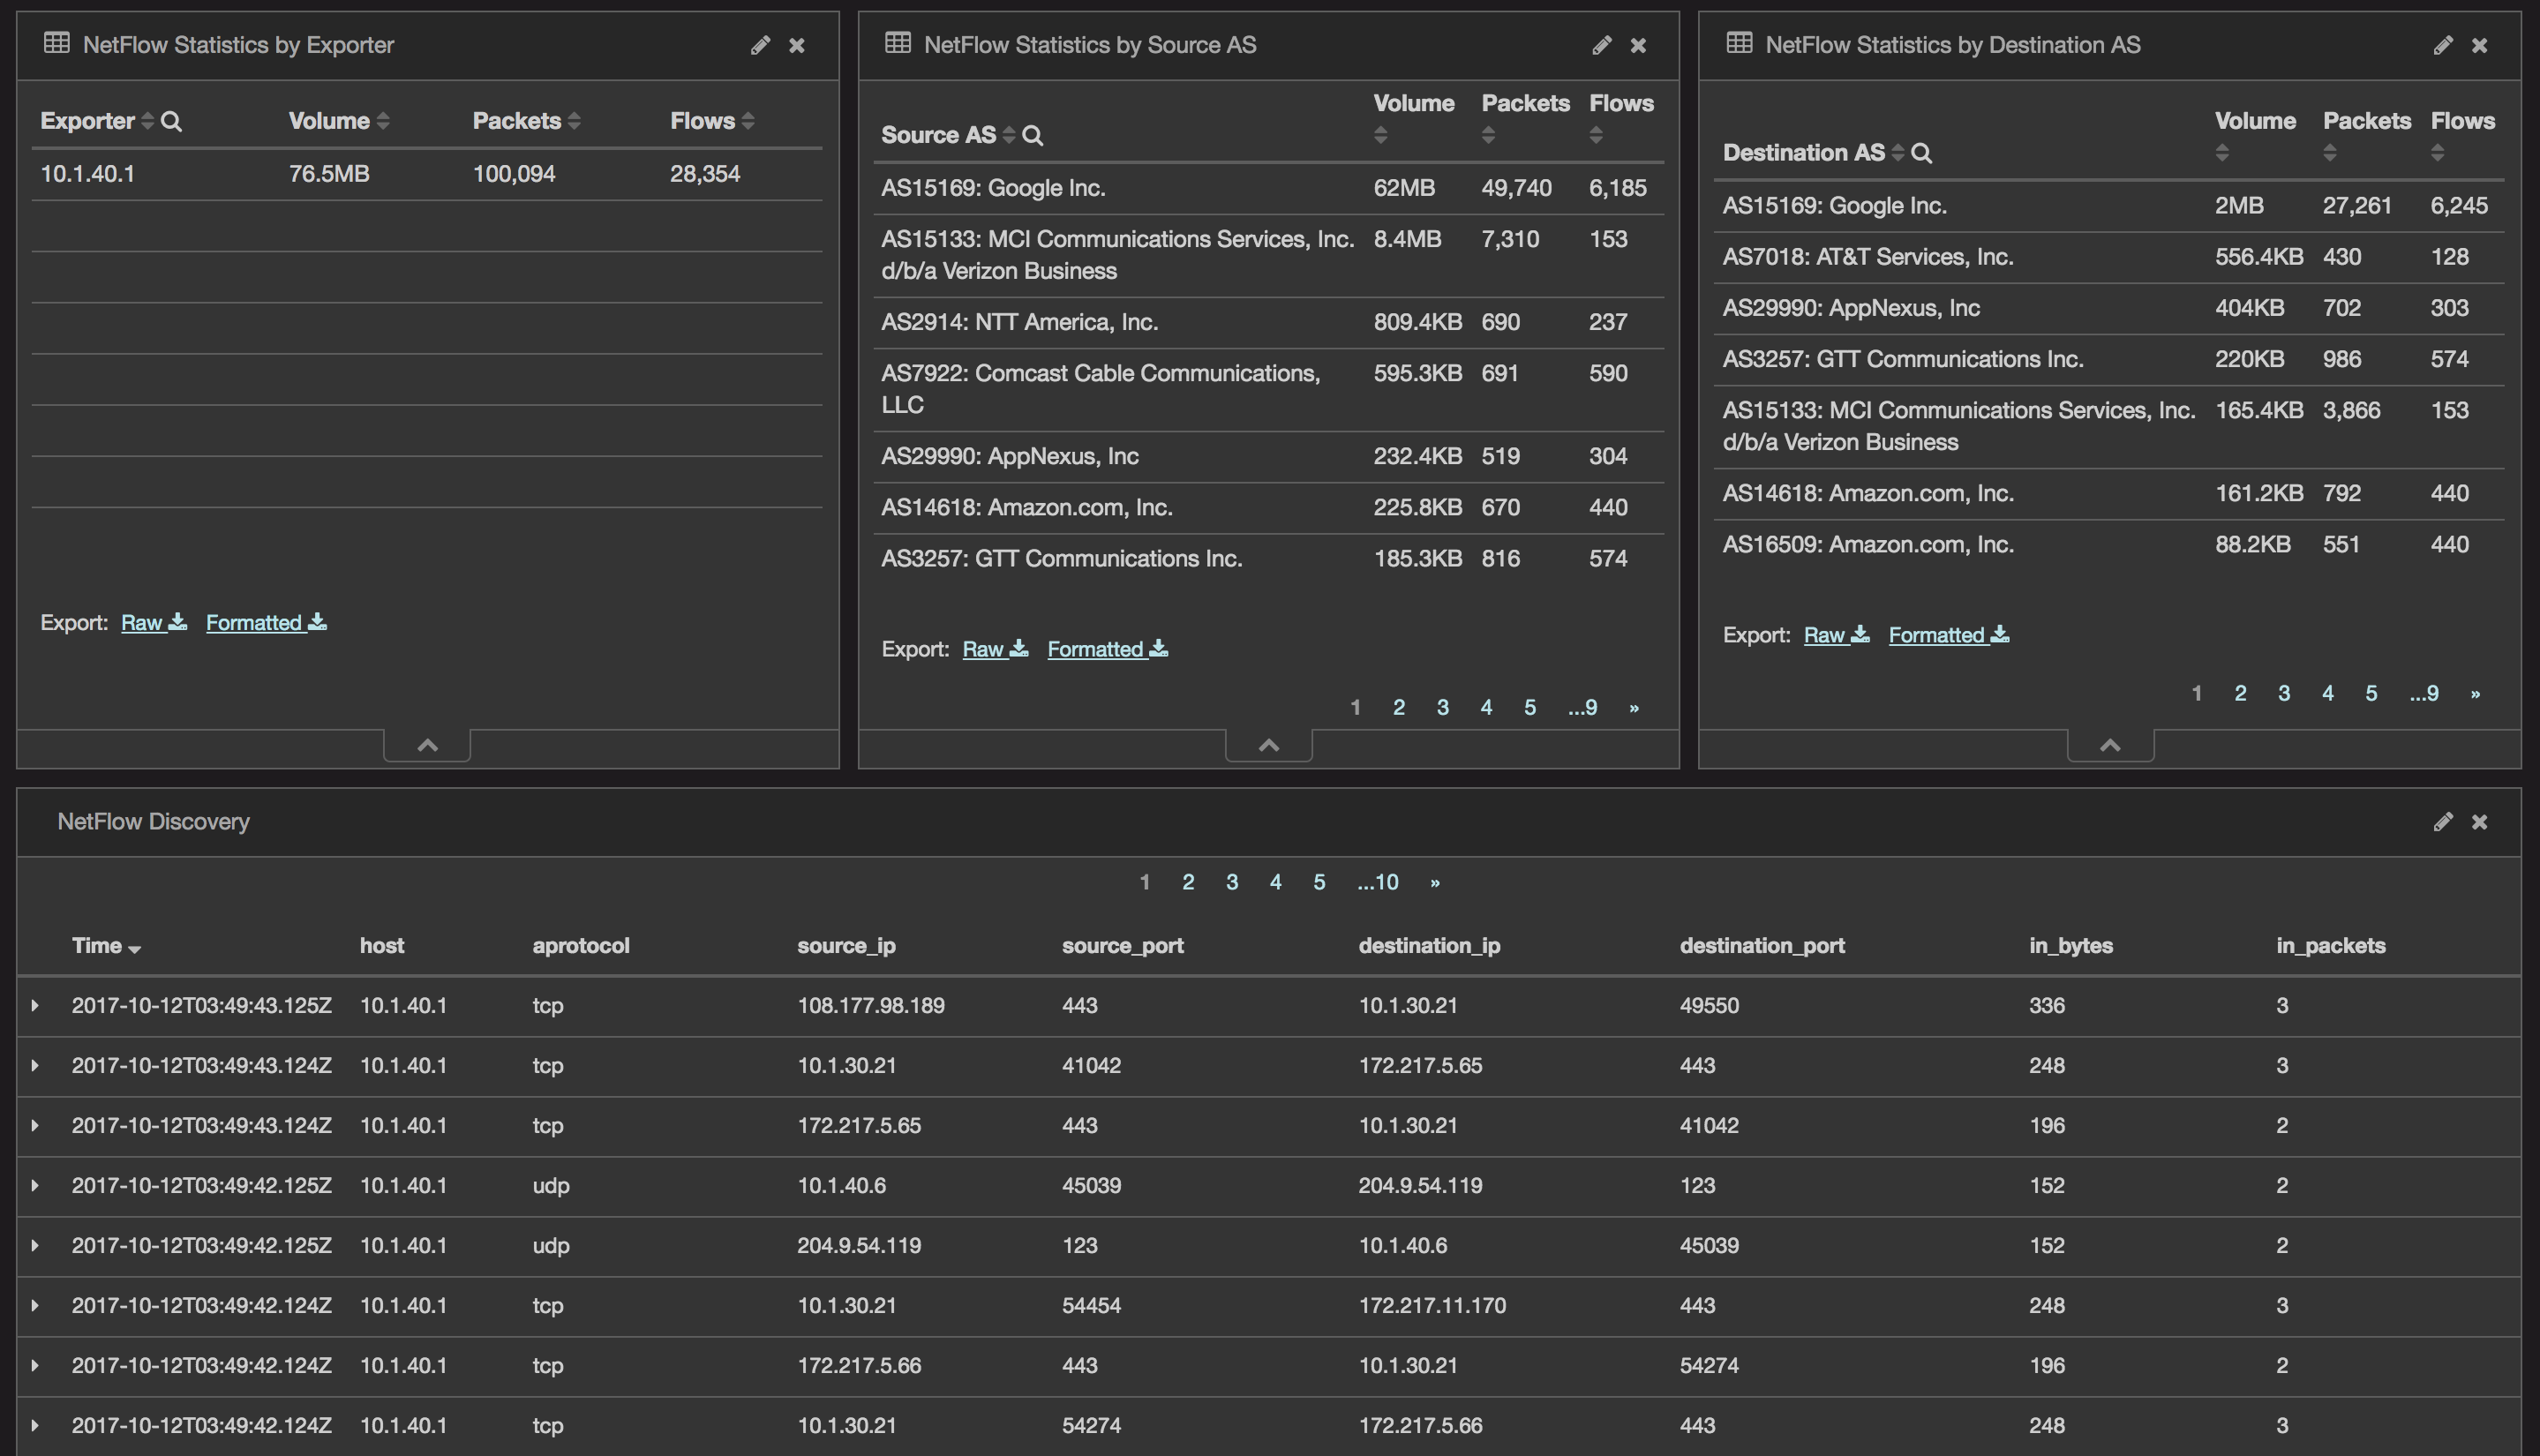
Figure 9: NetFlow Dashboard for Statistics by Explorer, Statistics by Source and Destination AS, and Discovery
Ntopng
Ntopng provides a real-time summary of lab network traffic obtained from NetFlow records.
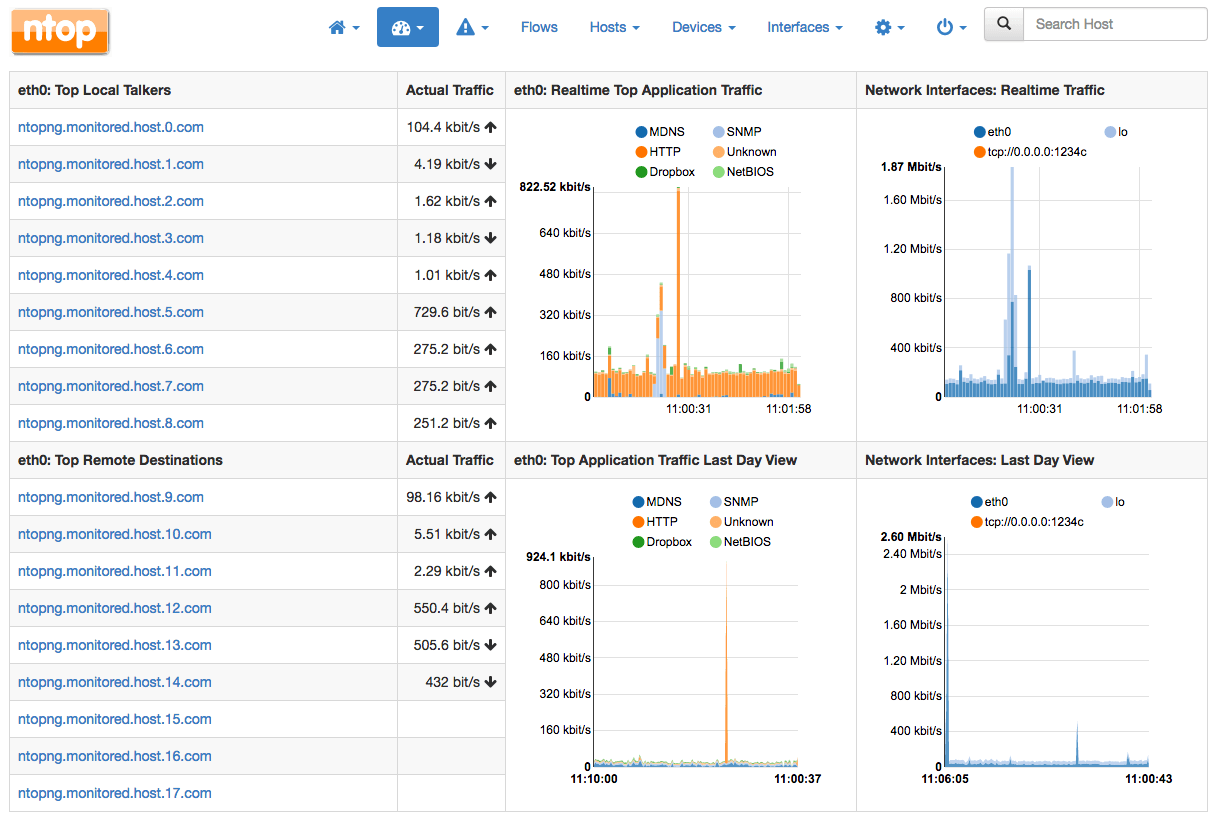
Figure 10: Ntopng Dashboard

Figure 11: Ntopng Active Flows
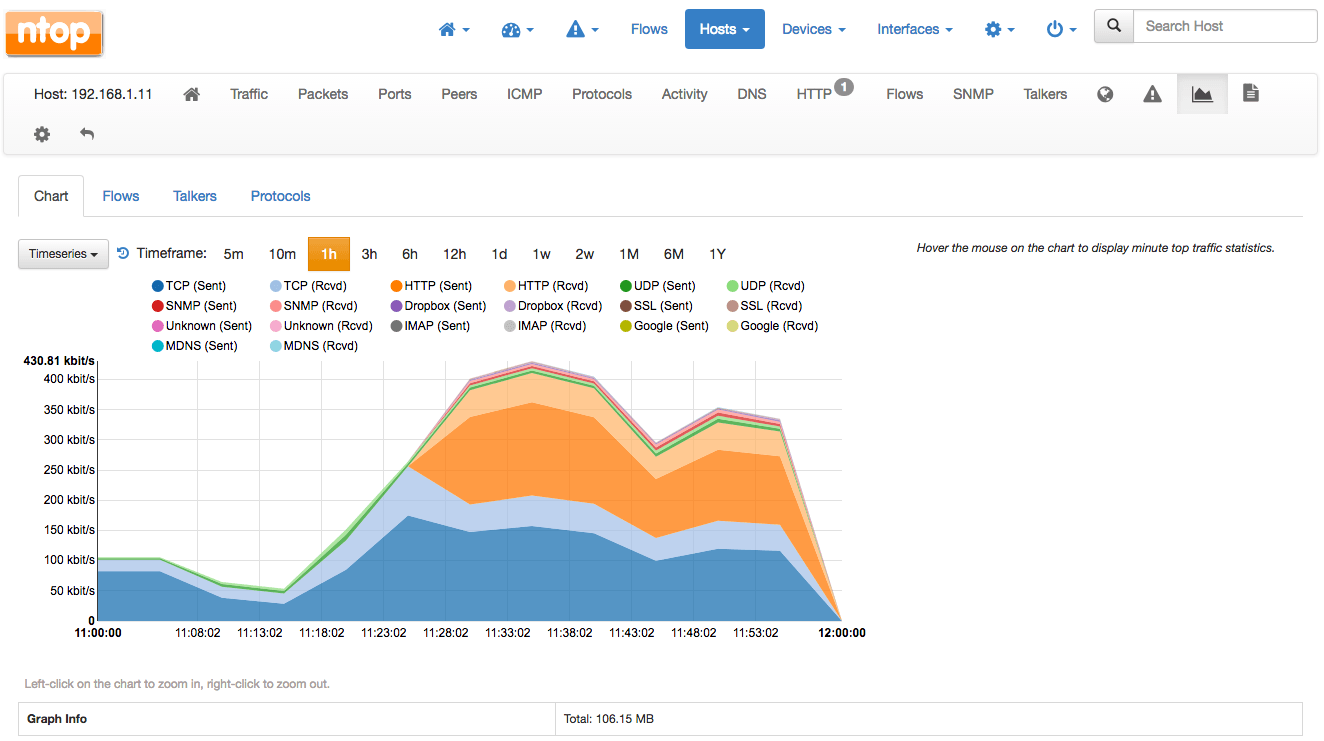
Figure 12: Ntopng Host Historical Summary